PL-300 Real Exam Questions

Microsoft Power BI Data Analyst

546 questions available · Page 1 of 55

Updated Exam DumpsVerified AnswersPass Guarantee

Get Complete Exam Dumps
Question 1 Single choice

You have a query that returns the data shown in the following exhibit.
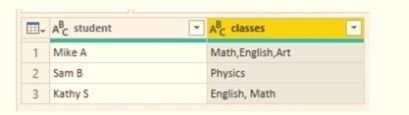
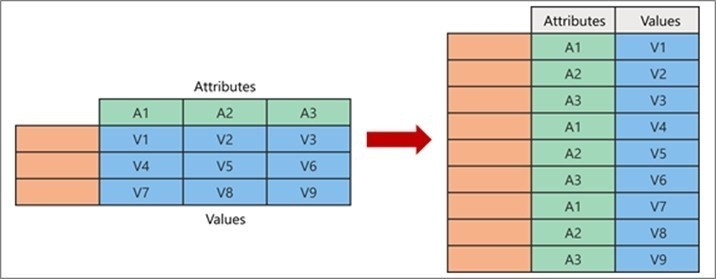
You need to configure the query to display the data as shown in the following exhibit.
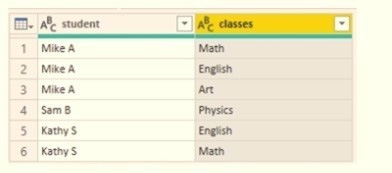
Which step should you use in the query?

  1. A

    =Table.ExpandListColum(Table.TransformColunins(Source, {{"classes".Splitter.SplitTextByDelimiter
    ('','', QuoteStyle.None), let itemType - (type nullable text) meta [Serialized.Text = true] in type
    {itemType}}}), "classes")

  2. B

    = Table.Unpivot(Source, {"classes"}, "Attribute", "Value")

  3. C

    = Table.SplitColumn(Source, "classes". Splitter.SplitTextByDelimiterf",", QuoteStyle.None),
    {"classes.1"})

  4. D

    = Table.SplitColumn(Source, "classes". Splitter.SplitTextByPositions({10}), {"classes.1"})

Show answer and explanation

Correct answer: B

Explanation

Power Query Unpivot columns: You might want to unpivot data, sometimes called flattening the data, to put it in a matrix format so that all similar values are in one column. This is necessary, for example, to create a chart or a report.
Chart

Note:
Syntax: Table.Unpivot(table as table, pivotColumns as list, attributeColumn as text, valueColumn as text) as table

Table.Unpivot translates a set of columns in a table into attribute-value pairs, combined with the rest of the values in each row.

References:
https://docs.microsoft.com/en-us/power-query/unpivot-column
https://docs.microsoft.com/en-us/powerquery-m/table-unpivot
Question 2 Drag & drop

DRAG DROP

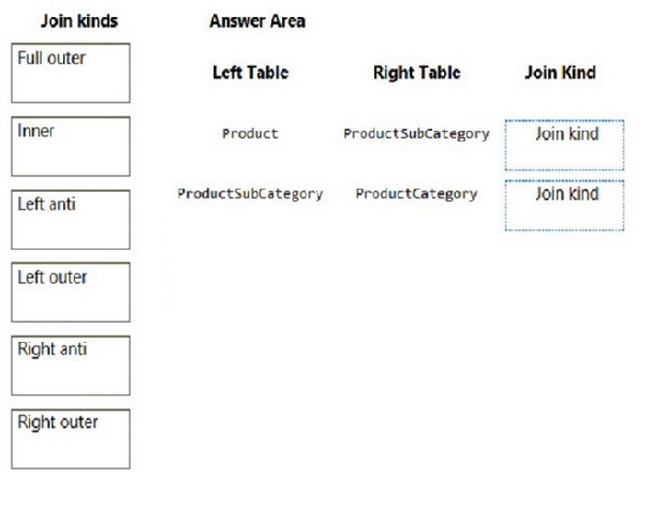
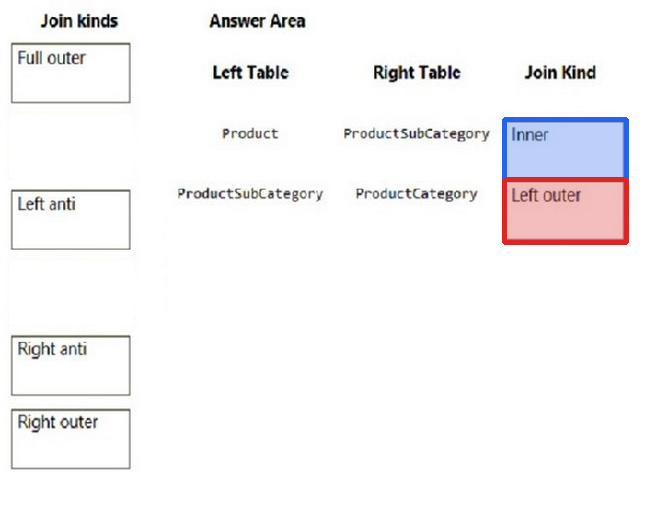
In Power Query Editor, you have three queries named ProductCategory, ProductSubCategory, and Product.

Every Product has a ProductSubCategory.

Not every ProductsubCategory has a parent ProductCategory.

You need to merge the three queries into a single query. The solution must ensure the best performance in Power Query.

How should you merge the tables? To answer, drag the appropriate merge types to the correct queries.
Each merge type may be used once, more than once, or not at all. You may need to drag the split bar between panes or scroll to view content.

NOTE: Each correct selection is worth one point.

Question diagram
Show answer and explanation
Correct answer diagram
Question 3 Hotspot

HOTSPOT

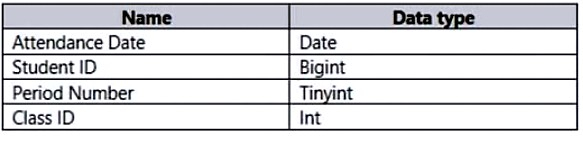
You plan to create a Power Bl dataset to analyze attendance at a school. Data will come from two separate views named View1 and View? in an Azure SQL database. View1 contains the columns shown in the following table.

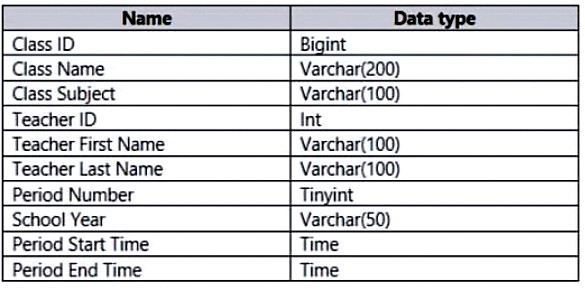
View2 contains the columns shown in the following table.

The views can be related based on the Class ID column.

Class ID is the unique identifier for the specified class, period, teacher, and school year. For example, the

same class can be taught by the same teacher during two different periods, but the class will have a different class ID.

You need to design a star schema data model by using the data in both views. The solution must facilitate the following analysis:

1. The count of classes that occur by period
2. The count of students in attendance by period by day
3. The average number of students attending a class each month

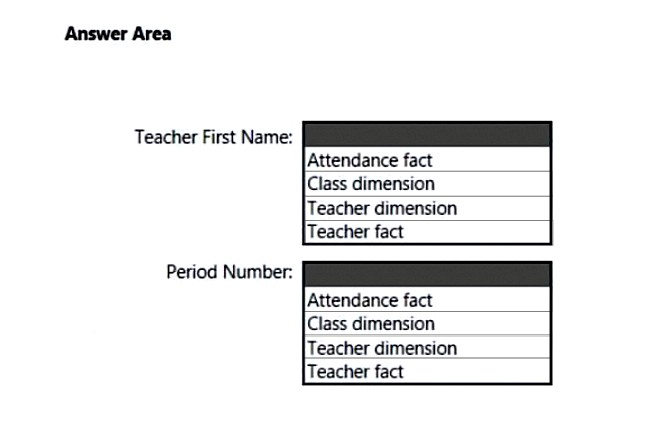
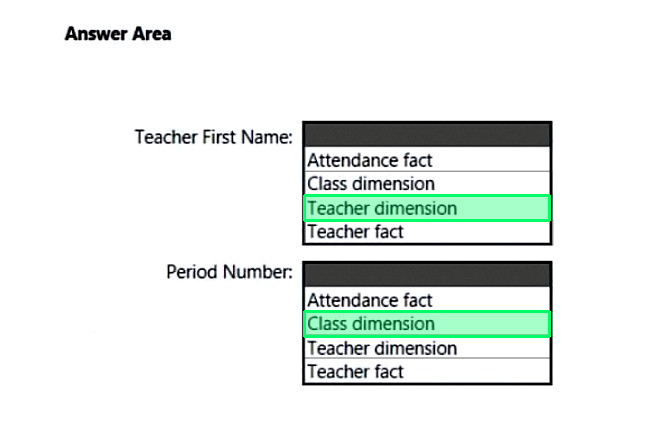
In which table should you include the Teacher First Name and Period Number fields? To answer, select the appropriate options in the answer area.
NOTE: Each correct selection is worth one point.

Question diagram
Show answer and explanation
Correct answer diagram
Question 4 Hotspot

HOTSPOT

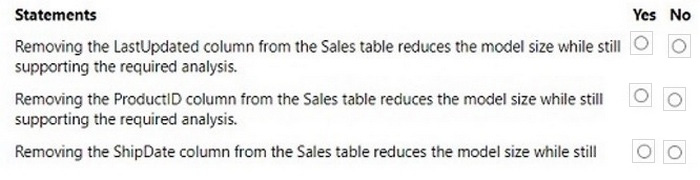
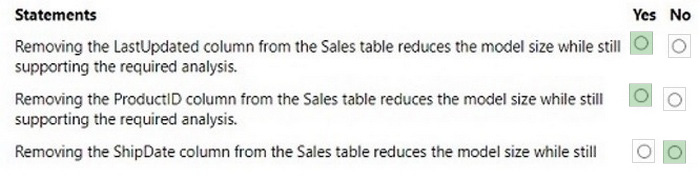
You have the Power BI data model shown in the following exhibit.

Select the appropriate yes or no.

Question diagram
Show answer and explanation
Correct answer diagram
Question 5 Multiple choice

You have a Power Bl semantic model that contains two queries.

You discover that a report based on the model has performance issues.

You plan to use Power Query to reduce the data loaded to the model.

Which two actions should you perform? Each correct answer presents part of the solution.

NOTE: Each correct answer is worth one point.

  1. A

    Apply group by and summarize techniques.

  2. B

    Combine the queries by using Append.

  3. C

    Remove unnecessary columns and rows.

  4. D

    Combine the queries by using Merge.

  5. E

    Create a new query group.

Show answer and explanation

Correct answers: A, C

Question 6 Single choice

You plan to create a Power BI report that will be connected to multiple data sources. One of the data
sources contains tax records.

You need to ensure that other queries cannot access the tax record information.

To what should you set Privacy Level for the data source?

  1. A

    Public

  2. B

    Organizational

  3. C

    Private

  4. D

    None

Show answer and explanation

Correct answer: C

Question 7 Single choice

Note: This question is part of a series of questions that present the same scenario. Each question in the series contains a unique solution that might meet the stated goals. Some question sets might have more than one correct solution, while others might not have a correct solution.

After you answer a question in this section, you will NOT be able to return to it. As a result, these questions will not appear in the review screen.

You have a Power BI report that imports a date table and a sales table from an Azure SQL database data source.

The sales table has the following date foreign keys:

1. Due Date
2. Order Date
3. Delivery Date

You need to support the analysis of sales over time based on all the date foreign keys.

Solution: You create measures that use the USERELATIONSHIP DAX function to filter sales on the active relationship between the sales table and the date table.

Does this meet the goal?

  1. A

    Yes

  2. B

    No

Show answer and explanation

Correct answer: B

Question 8 Single choice

Note: This question is part of a series of questions that present the same scenario. Each question in the series contains a unique solution that might meet the stated goals. Some question sets might have more

than one correct solution, while others might not have a correct solution. After you answer a question in this section, you will NOT be able to return to it. As a result, these questions will not appear in the review screen.

You have a Power BI report that imports a date table and a sales table from an Azure SQL Database data source. The sales table has the following date foreign keys:

Due Date

Order Date

Delivery Date

You need to support the analysis of sales over time based on all three dates at the same time.

Solution: You create measures that use the USERELATIONSHIP DAX function to filter sales on the inactive relationships between the sales table and the date table.

Does this meet the goal?

  1. A

    Yes

  2. B

    No

Show answer and explanation

Correct answer: B

Question 9 Single choice

You have a Microsoft Power Bl report. The size of PBIX file is 550 MB. The report is accessed by using an App workspace in shared capacity of powerbi.com.

The report uses an imported dataset that contains one fact table. The fact table contains 12 million rows.
The dataset is scheduled to refresh twice a day at 08:00 and 17:00.

The report is a single page that contains 15 AppSource visuals and 10 default visuals.

Users say that the report is slow to load the visuals when they access and interact with the report.

You need to recommend a solution to improve the performance of the report.

What should you recommend?

  1. A

    Replace the default visuals with AppSource visuals.

  2. B

    Change any DAX measures to use iterator functions.

  3. C

    Remove unused columns from tables in the data model.

  4. D

    Change the imported dataset to DirectQuery.

Show answer and explanation

Correct answer: C

Explanation

DirectQuery: No data is imported or copied into Power BI Desktop. Import: The selected tables and columns are imported into Power BI Desktop. As you create or interact with a visualization, Power BI
Desktop uses the imported data.

Benefits of using DirectQuery There are a few benefits to using DirectQuery: DirectQuery lets you build visualizations over very large datasets, where it would otherwise be unfeasible to first import all the data with pre-aggregation. Underlying data changes can require a refresh of data. For some reports, the need to display current data can require large data transfers, making reimporting data unfeasible. By contrast, DirectQuery reports always use current data.

The 1-GB dataset limitation doesn't apply to DirectQuery.

References:
https://docs.microsoft.com/en-us/power-bi/connect-data/desktop-use-directquery

Question 10 Multiple choice

You have a Power B1 semantic model named Model 1 that runs in import storage node.

You need to reduce the size of Model.

Which two action should you perform? Each connect answer presents a complete solution.

NOTE: Each correct selection is worth one point.

  1. A

    Summarize the detail data.

  2. B

    Change the active relationship between table to inactive relationship.

  3. C

    Optimize the column data types.

  4. D

    Upgrade to Power BI premium.

  5. E

    Implement row-level security (RLS).

Show answer and explanation

Correct answers: A, C