PL-300 Exam Details
-
Exam Code
:PL-300 -
Exam Name
:Microsoft Power BI Data Analyst -
Certification
:Microsoft Certifications -
Vendor
:Microsoft -
Total Questions
:546 Q&As -
Last Updated
:Jul 15, 2026
Microsoft PL-300 Online Questions & Answers
-
Question 41:
HOTSPOT
You have a Power BI workspace.
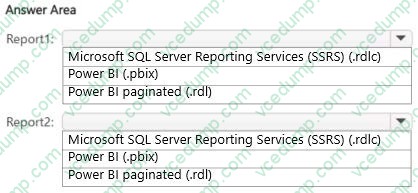
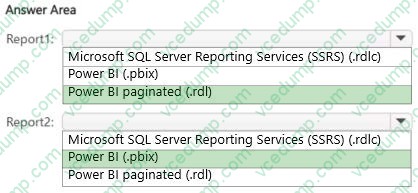
You need to create two reports that meet the following requirements:
1. Report1: Optimized for printing and can be delivered to users via a scheduled email subscription
2. Report2: Optimized for dynamic user interactivity
Which format should you use for each report? To answer, select the appropriate options in the answer area.
NOTE: Each correct selection is worth one point.
-
Question 42:
Note: This question is part of a series of questions that present the same scenario. Each question in the series contains a unique solution that might meet the stated goals. Some question sets might have more than one correct solution, while others might not have a correct solution.
After you answer a question in this scenario, you will NOT be able to return to it. As a result, these questions will not appear in the review screen.
You have several reports and dashboards in a workspace.
You need to grant all organizational users read access to a dashboard and several reports.
Solution: You enable included in app for all assets.
Does this meet the goal?
A. Yes
B. No -
Question 43:
You have a Power BI workspace named Workspace1 and a group named Group1.
You need to ensure that the members of Group1 are notified when there are issues in Workspace1. The solution must follow the principle of least privilege.
What should you do?
A. Assign Group1 the Admin role.
B. Update the contact list to include Group1.
C. Assign Group1 the Contributor role for Workspace1.
D. Assign Group1 the Member role for Workspace1. -
Question 44:
HOTSPOT
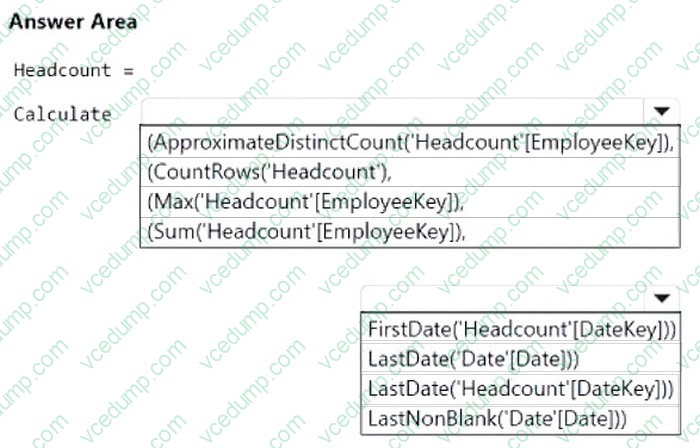
You are creating a Power BI report that will show the number of current employees over time. The report will use Import storage mode for all tables.
The employment data will be imported from Azure SQL Database in a monthly snapshot. The data will be stored in a table named Headcount and will contain the following:
1. One row per employee for each month the employee is employed
2. In each row, a date key that shows the first day of the month of each snapshot
You have a related date table that contains dates for the years 2020 to 2030.
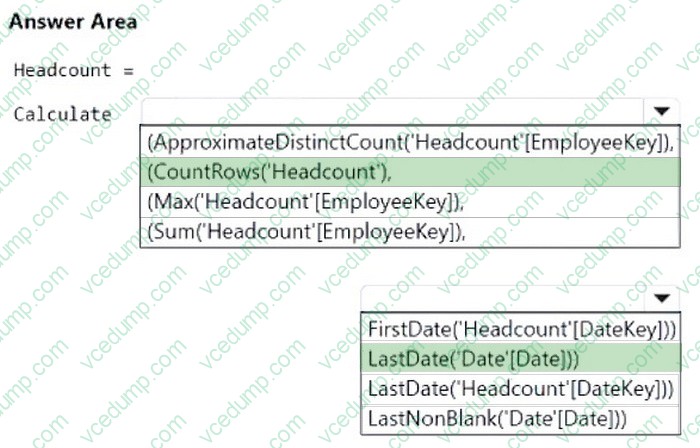
You need to create a semi-additive DAX measure that will return the count of employees for the last available date in a year, quarter, or month.
How should you complete the measure? To answer, select the appropriate options in the answer area.
-
Question 45:
Note: This question is part of a series of questions that present the same scenario. Each question in the series contains a unique solution that might meet the stated goals. Some question sets might have more than one correct solution, while others might not have a correct solution.
After you answer a question in this section, you will NOT be able to return to it. As a result, these questions will not appear in the review screen.
You have an on-premises data gateway.
You need to reduce the amount of data sent through the gateway by semantic models that run in import storage mode.
Solution: You configure incremental refresh.
Does this meet the goal?
A. Yes
B. No -
Question 46:
You have a semantic model named Model1.
You need to ensure that users can verify that the data in Model1 meets corporate standards.
What should you do?
A. Promote Model1.
B. Create an image of Model1.
C. Apply a sensitivity label to Model1.
D. Certify Model1. -
Question 47:
DRAG DROP
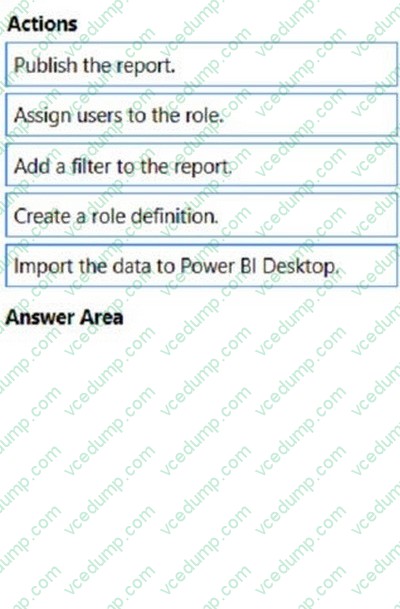
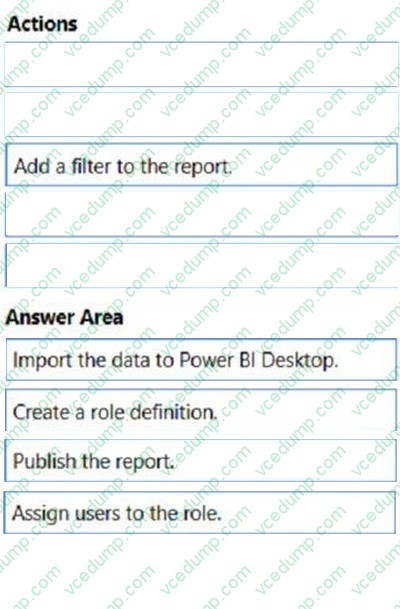
You plan to create a report that will display sales data from the last year for multiple regions
You need to restrict access to individual rows of the data on a per region-basis by using roles.
Which four actions should you perform in sequence?
To answer, move the appropriate actions from the list of actions to the answer area and arrange them in the correct order.
Select and Place:
-
Question 48:
Note: This question is part of a series of questions that present the same scenario. Each question in the series contains a unique solution that might meet the stated goals. Some question sets might have more than one correct solution, while others might not have a correct solution.
After you answer a question in this section, you will NOT be able to return to it. As a result, these questions will not appear in the review screen.
You have an on-premises data gateway.
You need to reduce the amount of data sent through the gateway by semantic models that run in import storage mode.
Solution: You increase Automatic page refresh intervals.
Does this meet the goal?
A. Yes
B. No -
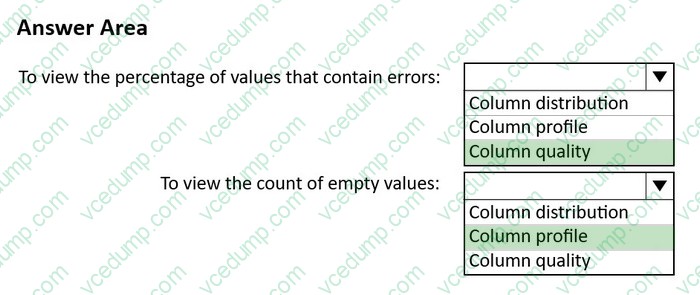
Question 49:
HOTSPOT
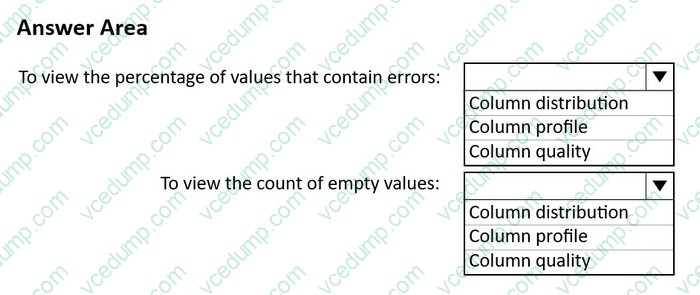
You use Power Query Editor to review a query that contains a column named Country.
You need to view the following information in the Data preview view for the Country column:
1. The percentage of values that contain errors.
2. The count of empty values.
What should you enable? To answer, select the appropriate options in the answer area.
NOTE: Each correct selection is worth one point.
-
Question 50:
You have a table named DiMCountries that contains a column named Country as shown in the following table.
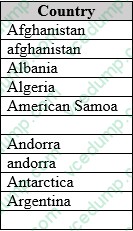
You plan to use DiMCountnes as a dimension m a report.
You new to ensure that the Country column in DiMCountnes lists each country only once.
Which two actions should you perform on the Country column?
Each correct answer presents part of the solution. NOTE: Each correct answer is worth one point.
A. Replace the empty fields.
B. Apply a clean transform.
C. Remove duplicate values.
D. Change Data category to Country.
E. Apply a Capitalize Each Word transform.
Related Exams:
-
62-193
Technology Literacy for Educators -
70-243
Administering and Deploying System Center 2012 Configuration Manager -
70-355
Universal Windows Platform – App Data, Services, and Coding Patterns -
77-420
Excel 2013 -
77-427
Excel 2013 Expert Part One -
77-725
Word 2016 Core Document Creation, Collaboration and Communication -
77-726
Word 2016 Expert Creating Documents for Effective Communication -
77-727
Excel 2016 Core Data Analysis, Manipulation, and Presentation -
77-728
Excel 2016 Expert: Interpreting Data for Insights -
77-731
Outlook 2016 Core Communication, Collaboration and Email Skills
Tips on How to Prepare for the Exams
Nowadays, the certification exams become more and more important and required by more and more enterprises when applying for a job. But how to prepare for the exam effectively? How to prepare for the exam in a short time with less efforts? How to get a ideal result and how to find the most reliable resources? Here on Vcedump.com, you will find all the answers. Vcedump.com provide not only Microsoft exam questions, answers and explanations but also complete assistance on your exam preparation and certification application. If you are confused on your PL-300 exam preparations and Microsoft certification application, do not hesitate to visit our Vcedump.com to find your solutions here.