PL-300 Exam Details
-
Exam Code
:PL-300 -
Exam Name
:Microsoft Power BI Data Analyst -
Certification
:Microsoft Certifications -
Vendor
:Microsoft -
Total Questions
:546 Q&As -
Last Updated
:Jul 15, 2026
Microsoft PL-300 Online Questions & Answers
-
Question 91:
You are building a Power Bl report that uses data from an Azure SQL database named erp1.
You Import the following tables.

You need to perform the following analyses:
1. Orders sold over time that include a measure of the total order value
2. Orders by attributes of products sold
The solution must minimize update times when interacting with visuals in the report.
What should you do first?
A. From Power Query, merge the Orders query and the Order Line Hems query.
B. Calculate the count of orders per product by using a DAX function.
C. Create a calculated column that adds a list of product categories to the Orders table by using a DAX function.
D. From Power Query, merge the Order Line Items query and the Products query. -
Question 92:
You build a Power Bl report that displays 10T temperature data streaming from a refrigerator.
You publish the report to the Bl service.
You need to be notified when the temperature rises above four degrees Celsius.
What should you do?
A. Pin a report page to a dashboard and set an alert on the page.
B. Set an alert on a KPI visual in the report.
C. Pin a card visual to a dashboard and set an alert on the tile.
D. Pin a card visual to a dashboard and create a subscription. -
Question 93:
HOTSPOT
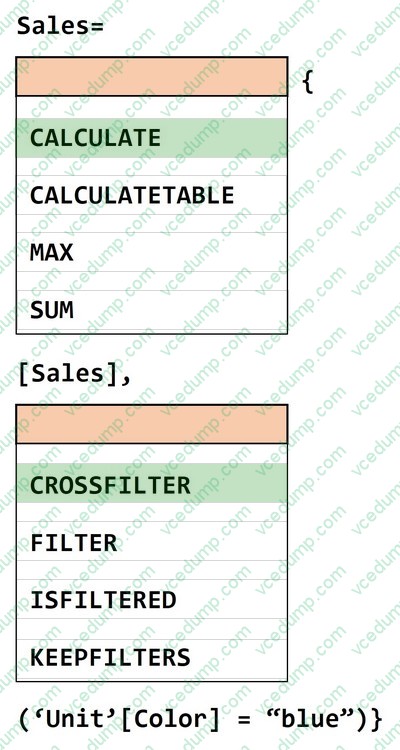
You have a Power BI semantic model named Model1.
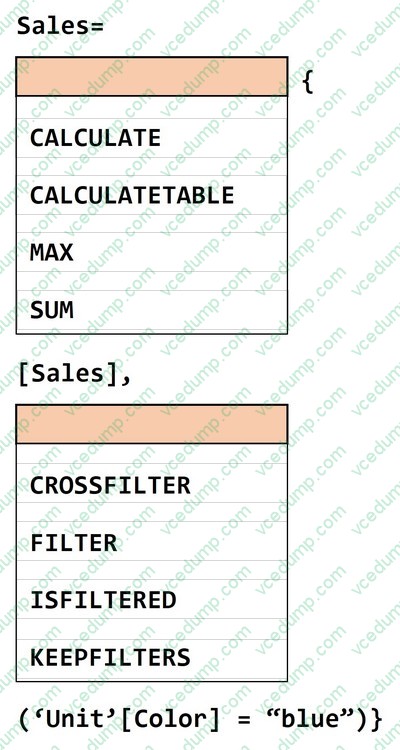
You need to create a measure that will display the sales result for all units. The solution must maintain the existing filter.
How should you complete the DAX expression? TO answer, select the appropriate options in the answer area.
NOTE: Each correct selection is worth one point.
-
Question 94:
You use Power Query Editor to preview a query that contains sales order data in the following columns:
1. Tax Amount
2. Sales Order ID
3. Freight Amount
4. Subtotal Amount
5. Total Item Quantity
The Sales Order ID column uniquely identifies each sales order. The Subtotal Amount and Total Item Quantity columns are always populated, but the Tax Amount and Freight Amount columns are sometimes null when an order has no associated amount.
You need to query the data to identify the following metrics by month:
1. The average item quantity per order
2. The average freight amount per order
3. The maximum item quantity per order
How should you modify the query?
A. In the Total Item Quantity column, replace the null values with 0.
B. In the Tax Amount column, remove rows that contain null values.
C. In the Freight Amount column, remove rows that contain null values.
D. In the Freight Amount column, replace the null values with 0. -
Question 95:
You have a Power BI semantic model that contains the following data.
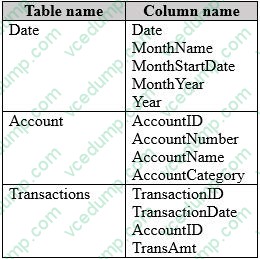
You need to create a solution that meets the following requirements:
1. Presents transaction amount totals for each month for the current and prior year
2. Follows the star schema modeling approach
3. Minimizes the data model size
Which three actions should you perform? (Choose three)
Each correct answer presents part of the solution. NOTE: Each correct selection is worth one point.
A. Create one-to-many relationships between the tables
B. In the Transactions query, delete the TransactionID column.
C. In the Date query, group by MonthNumber.
D. In the Transactions query, group by AccountID and MonthStartDate for TransactionDate. Aggregate by summing the TransAmt column.
E. In the Transactions query, add a column that contains the MonthStartDate value for TransactionDate.
F. Create many-to-many relationships between the tables. -
Question 96:
DRAG DROP
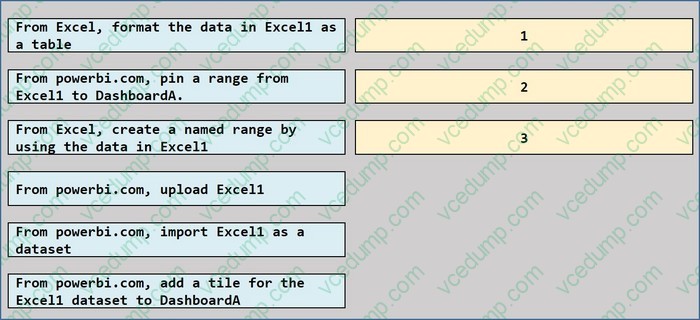
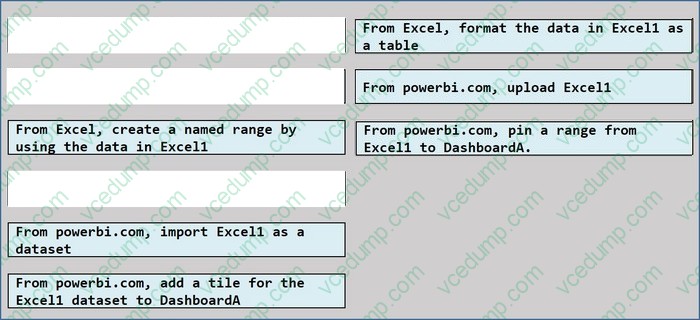
You have a Microsoft Exert spreadsheet named Excel1 that contains survey results.
You have a Power Bl dashboard named DashboardA that has Q&A enabled.
You need to ensure that users who can access DashboardA can ask Questions based on the contents of Excel 1 and pm visuals based on their queries to DashboardA. The solution must minimize development time.
Which three actions should you perform in sequence? To answer, move the appropriate actions from the list of actions to the answer area and arrange them in the correct order.
Select and Place:
-
Question 97:
In Power Bi Desktop, you are creating visualizations in a report based on an imported dataset
You need to allow Power Bi users to export the summarized data used to create the visualizations but prevent the users from exporting the underlying data What should you do?
A. From Power BI Desktop, configure the Data Load settings for the current file.
B. From the Power BI service, configure the dataset permissions.
C. From Power BI Desktop, configure the Report settings for the current file.
D. From Power BI Desktop, modify the data source permissions. -
Question 98:
HOTSPOT
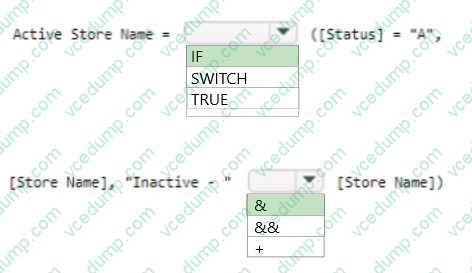
You have a Power 31 data model that contains a table named Stores. The table has the following columns:
1. Store Name
2. Open Date
3. Status
4. State
5. City
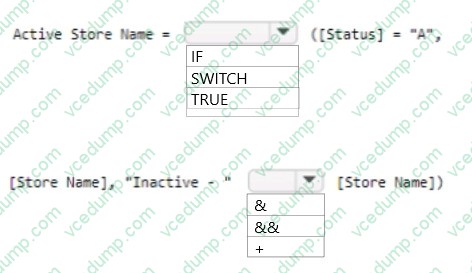
You need to create a calculated column named Active Store Name that meets the following requirements:
1. When the value of the Status column is "A", the value in the Store Name column must be returned.
2. When the value of the Status column is NOT "A", the value in the Store Name column that is prefixed with "Inactive - " must be returned.
How should you complete the DAX expression? To answer, select the appropriate options in the answer area.
-
Question 99:
You have a Power BI report that will be rendered on a vertical display.
You need to maximize the portion of the screen area used by the report.
What should you do?
A. From the Canvas background setting of Power BI Desktop, configure the Image fit setting.
B. From the Canvas settings of Power BI Desktop, set a custom width and height.
C. From Power BI Desktop, select Personalize visuals.
D. From the Power BI service, enable the Pages pane. -
Question 100:
You need to create the On-Time Shipping report. The report must include a visualization that shows the percentage of late orders.
Which type of visualization should you create?
A. bar chart
B. scatterplot
C. pie chart
Related Exams:
-
62-193
Technology Literacy for Educators -
70-243
Administering and Deploying System Center 2012 Configuration Manager -
70-355
Universal Windows Platform – App Data, Services, and Coding Patterns -
77-420
Excel 2013 -
77-427
Excel 2013 Expert Part One -
77-725
Word 2016 Core Document Creation, Collaboration and Communication -
77-726
Word 2016 Expert Creating Documents for Effective Communication -
77-727
Excel 2016 Core Data Analysis, Manipulation, and Presentation -
77-728
Excel 2016 Expert: Interpreting Data for Insights -
77-731
Outlook 2016 Core Communication, Collaboration and Email Skills
Tips on How to Prepare for the Exams
Nowadays, the certification exams become more and more important and required by more and more enterprises when applying for a job. But how to prepare for the exam effectively? How to prepare for the exam in a short time with less efforts? How to get a ideal result and how to find the most reliable resources? Here on Vcedump.com, you will find all the answers. Vcedump.com provide not only Microsoft exam questions, answers and explanations but also complete assistance on your exam preparation and certification application. If you are confused on your PL-300 exam preparations and Microsoft certification application, do not hesitate to visit our Vcedump.com to find your solutions here.