Exam Details
Exam Code
:PL-300Exam Name
:Microsoft Power BI Data AnalystCertification
:Microsoft CertificationsVendor
:MicrosoftTotal Questions
:435 Q&AsLast Updated
:Aug 05, 2025
Microsoft Microsoft Certifications PL-300 Questions & Answers
-
Question 21:
You import a Power Bl dataset that contains the following tables:
1.
Date
2.
Product
3.
Product Inventory
The Product inventory table contains 25 million rows. A sample of the data is shown in the following table.
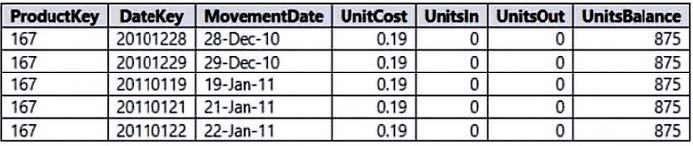
The Product Inventory table relates to the Date table by using the DateKey column.
The Product inventory table relates to the Product table by using the ProductKey column.
You need to reduce the size of the data model without losing information.
What should you do?
A. Change Summarization for DateKey to Don't Summarize.
B. Change the data type of UnitCost to Integer.
C. Remove the relationship between Date and Product Inventory.
D. Remove MovementDate.
-
Question 22:
You need to create a Power Bl theme that will be used in multiple reports. The theme will include corporate branding for font size, color, and bar chart formatting. What should you do?
A. Create a theme as a PBIVIZ file and import the theme into Power Bl Desktop.
B. Create a theme as a JSON file and import the theme into Power Bl Desktop.
C. From Power Bl Desktop, use a built-in report theme.
D. From Power Bl Desktop, customize the current theme.
-
Question 23:
You have an app workspace that contains a dashboard and four reports. All the reports are generated from a single dataset that contains sales data for your company. The reports display the data configured as shown in the following table.
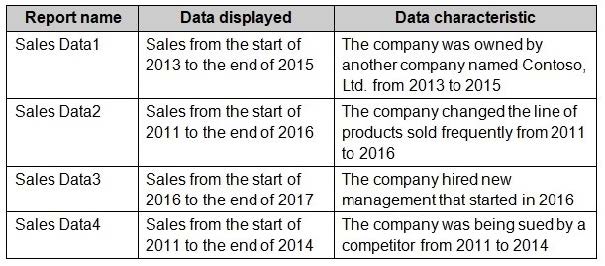
You need to ensure that the users of the reports can locate the correct report by using natural language queries. What should you do?
A. From the properties of the dataset, create four Featured QandA Questions.
B. From the Format settings of the reports, modify the Page Information.
C. From the properties of the dataset, modify the QandA and Cortana settings.
D. From the properties of the workspace, modify the Language Settings.
-
Question 24:
Note: This question is part of a series of questions that present the same scenario. Each question in the series contains a unique solution that might meet the stated goals. Some question sets might have more than one correct solution, while
others might not have a correct solution.
After you answer a question in this section, you will NOT be able to return to it. As a result, these questions will not appear in the review screen. You have a Power BI model that contains two tables named Sales and Date. Sales contains four
columns named TotalCost, DueDate, ShipDate, and OrderDate. Date contains one column named Date.
The tables have the following relationships:
Sales[DueDate] and Date[Date]
Sales[ShipDate] and Date[Date]
Sales[OrderDate] and Date[Date]
The active relationship is on Sales[DueDate].
You need to create measures to count the number of orders by [ShipDate] and the orders by [OrderDate]. You must meet the goal without duplicating data or loading additional data.
Solution: You create measures that use the CALCULATE, COUNT, and USERELATIONSHIP DAX functions.
Does this meet the goal?
A. Yes
B. No
-
Question 25:
You have a Power BI dashboard that monitors the quality of manufacturing processes. The dashboard contains the following elements:
A line chart that shows the number of defective products manufactured by day. A KPI visual that shows the current daily percentage of defective products manufactured.
You need to be notified when the daily percentage of defective products manufactured exceeds 3%.
What should you create?
A. a QandA visual
B. a subscription
C. a smart narrative visual
D. an alert
-
Question 26:
You have a Power Bl report that uses row-level security (RLS).
You need to transfer RLS membership maintenance to an Azure network security team. The solution must NOT provide the Azure network security team with the ability to manage reports, datasets. or dashboards.
What should you do?
A. Add the Azure network security team as members of the RLS role.
B. Instruct the Azure network security team to create security groups. Configure RLS to use the groups.
C. Configure custom instructions for the Request access feature that instructs users to contact the Azure network security team.
D. Grant the Read and Build permissions for the Power Bl datasets to the Azure network security team.
-
Question 27:
You have a Power BI tenant.
You have reports that use financial datasets and are exported as PDF files.
You need to ensure that the reports are encrypted.
What should you implement?
A. dataset certifications
B. row-level security (RLS)
C. sensitivity labels
D. Microsoft Intune policies
-
Question 28:
Note: This question is part of a series of questions that present the same scenario. Each question in the series contains a unique solution that might meet the stated goals. Some question sets might have more than one correct solution, while
others might not have a correct solution.
After you answer a question in this section, you will NOT be able to return to it. As a result, these questions will not appear in the review screen.
You are modeling data by using Microsoft Power Bl. Part of the data model is a large Microsoft SQL Server table named Order that has more than 100 million records.
During the development process, you need to import a sample of the data from the Order table.
Solution: You add a WHERE clause to the SQL statement.
Does this meet the goal?
A. Yes
B. No
-
Question 29:
Note: This question is part of a series of questions that present the same scenario. Each question in the series contains a unique solution that might meet the stated goals. Some question sets might have more than one correct solution, while
others might not have a correct solution.
After you answer a question in this section, you will NOT be able to return to it. As a result, these questions will not appear in the review screen.
You are modeling data by using Microsoft Power BI. Part of the data model is a large Microsoft SQL Server table named Order that has more than 100 million records.
During the development process, you need to import a sample of the data from the Order table. Solution: From Power Query Editor, you import the table and then add a filter step to the query. Does this meet the goal?
A. Yes
B. No
-
Question 30:
You are creating a Power BI report to analyze consumer purchasing patterns from a table named Transactions. The Transactions table contains a numeric field named Spend.
You need to include a visual that identifies which fields have the greatest impact on Spend.
Which type of visual should you use?
A. decomposition tree
B. QandA
C. smart narrative
D. key influences
Related Exams:
62-193
Technology Literacy for Educators70-243
Administering and Deploying System Center 2012 Configuration Manager70-355
Universal Windows Platform – App Data, Services, and Coding Patterns77-420
Excel 201377-427
Excel 2013 Expert Part One77-725
Word 2016 Core Document Creation, Collaboration and Communication77-726
Word 2016 Expert Creating Documents for Effective Communication77-727
Excel 2016 Core Data Analysis, Manipulation, and Presentation77-728
Excel 2016 Expert: Interpreting Data for Insights77-731
Outlook 2016 Core Communication, Collaboration and Email Skills
Tips on How to Prepare for the Exams
Nowadays, the certification exams become more and more important and required by more and more enterprises when applying for a job. But how to prepare for the exam effectively? How to prepare for the exam in a short time with less efforts? How to get a ideal result and how to find the most reliable resources? Here on Vcedump.com, you will find all the answers. Vcedump.com provide not only Microsoft exam questions, answers and explanations but also complete assistance on your exam preparation and certification application. If you are confused on your PL-300 exam preparations and Microsoft certification application, do not hesitate to visit our Vcedump.com to find your solutions here.