8008 Exam Details
-
Exam Code
:8008 -
Exam Name
:PRM Certification - Exam III: Risk Management Frameworks, Operational Risk, Credit Risk, Counterparty Risk, Market Risk, ALM, FTP - 2015 Edition -
Certification
:PRMIA Certifications -
Vendor
:PRMIA -
Total Questions
:362 Q&As -
Last Updated
:Jul 15, 2026
PRMIA 8008 Online Questions & Answers
-
Question 261:
The probability of default of a security over a 1 year period is 3%. What is the probability that it would have defaulted within 6 months?
A. 98.49%
B. 3.00%
C. 1.51%
D. 17.32% -
Question 262:
The 10-day VaR of a diversified portfolio is $100m. What is the 20-day VaR of the same portfolio assuming the market shows a trend and the autocorrelation between consecutive periods is 0.2?
A. 100
B. 200
C. 154.92
D. 141.42 -
Question 263:
The sensitivity (delta) of a portfolio to a single point move in the value of the SandP500 is $100. If the current level of the SandP500 is 2000, and has a one day volatility of 1%, what is the value-at-risk for this portfolio at the 99% confidence and a horizon of 10 days? What is this method of calculating VaR called?
A. $14,736, parametric VaR
B. $4,660, Monte Carlo simulation VaR
C. $14,736, historical simulation VaR
D. $4,660, parametric VaR -
Question 264:
Calculate the 99% 1-day Value at Risk of a portfolio worth $10m with expected returns of 10% annually and volatility of 20%.
A. 290218
B. 2326000
C. 126491
D. 294218 -
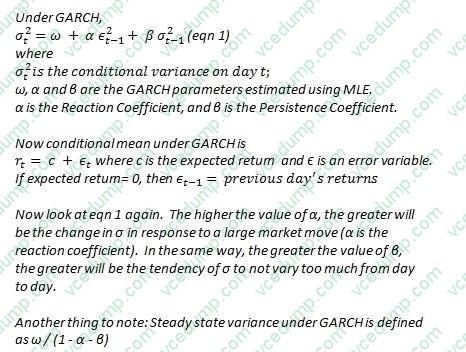
Question 265:
A risk analyst uses the GARCH model to forecast volatility, and the parameters he uses are = 0.001%, = 0.05 and = 0.93. Yesterday's daily volatility was calculated to be 1%. What is the long term annual volatility under the analyst's model?
A. 3.54 %
B. 0.25 %
C. 0.22 %
D. 7.94 % -
Question 266:
Which of the following statements are true:
I - Top down approaches help focus management attention on the frequency and severity of loss events, while bottom up approaches do not.
II - Top down approaches rely upon high level data while bottom up approaches need firm specific risk data to estimate risk.
III - Scenario analysis can help capture both qualitative and quantitative dimensions of operational risk.
A. III only
B. II and III
C. I only
D. II only -
Question 267:
Which of the following can be used to reduce credit exposures to a counterparty:
I - Netting arrangements II - Collateral requirements III - Offsetting trades with other counterparties IV - Credit default swaps
A. I and II
B. I, II, III and IV
C. I, II and IV
D. III and IV -
Question 268:
Under the CreditPortfolio View model of credit risk, the conditional probability of default will be:
A. lower than the unconditional probability of default in an economic expansion
B. higher than the unconditional probability of default in an economic expansion
C. lower than the unconditional probability of default in an economic contraction
D. the same as the unconditional probability of default in an economic expansion -
Question 269:
Which of the following statements are true with respect to stress testing:
I - Stress testing results in a dollar estimate of losses II - The results of stress testing can replace VaR as a measure of risk as they are better grounded in reality III - Stress testing provides an estimate of losses at a desired level of confidence IV - Stress testing based on factor shocks can allow modeling extreme events that have not occurred in the past
A. I and IV
B. I, II and IV
C. II and III
D. II, III and IV -
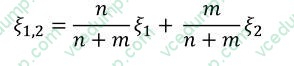
Question 270:
For a hypotherical UoM, the number of losses in two non-overlapping datasets is 24 and 32 respectively. The Pareto tail parameters for the two datasets calculated using the maximum likelihood estimation method are 2 and 3. What is an estimate of the tail parameter of the combined dataset?
A. 2.57
B. 2.23
C. 3
D. Cannot be determined
Related Exams:
-
8002
PRM Certification - Exam II: Mathematical Foundations of Risk Measurement -
8004
PRM Certification - Exam IV: Case Studies; Standards: Governance, Best Practices and Ethics -
8006
Exam I: Finance Theory Financial Instruments Financial Markets - 2015 Edition -
8007
Exam II: Mathematical Foundations of Risk Measurement - 2015 Edition -
8008
PRM Certification - Exam III: Risk Management Frameworks, Operational Risk, Credit Risk, Counterparty Risk, Market Risk, ALM, FTP - 2015 Edition -
8009
Exam IV: Case Studies: Standards: Governance, Best Practices and Ethics - 2015 Edition -
8010
Operational Risk Manager (ORM) -
8011
Credit and Counterparty Manager (CCRM) Certificate
Tips on How to Prepare for the Exams
Nowadays, the certification exams become more and more important and required by more and more enterprises when applying for a job. But how to prepare for the exam effectively? How to prepare for the exam in a short time with less efforts? How to get a ideal result and how to find the most reliable resources? Here on Vcedump.com, you will find all the answers. Vcedump.com provide not only PRMIA exam questions, answers and explanations but also complete assistance on your exam preparation and certification application. If you are confused on your 8008 exam preparations and PRMIA certification application, do not hesitate to visit our Vcedump.com to find your solutions here.