TDA-C01 Exam Details
-
Exam Code
:TDA-C01 -
Exam Name
:Tableau Certified Data Analyst -
Certification
:Tableau Certifications -
Vendor
:Tableau -
Total Questions
:117 Q&As -
Last Updated
:May 27, 2026
Tableau TDA-C01 Online Questions & Answers
-
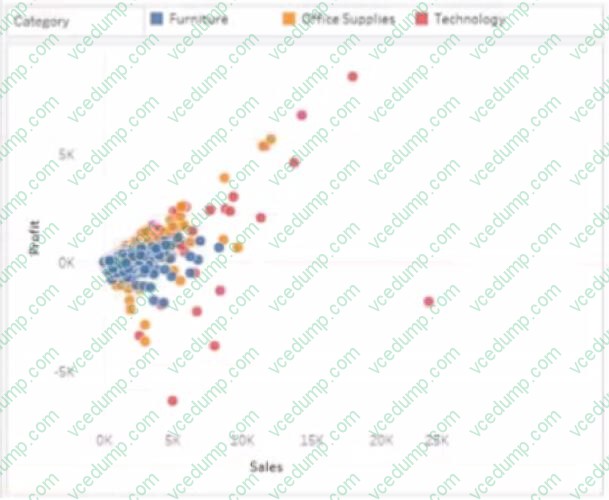
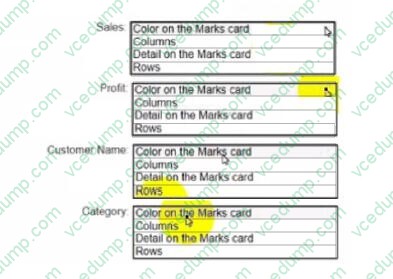
Question 81:
HOTSPOT
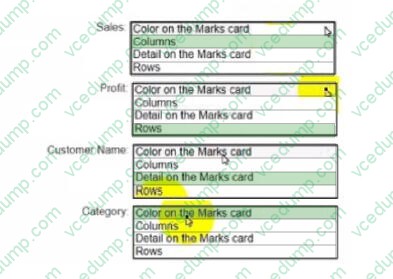
You have a dataset that has four fields named Category. Profit Sates and Customer Name. You need to create the following visualization.
-
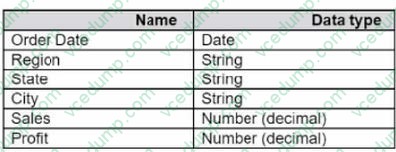
Question 82:
You have the following dataset.

You want to create a new calculated dimension field named Category that meets the following conditions:
When Subject is Computer Science or Science, Category must be Sciences. When Subject is English or Social Studies, Category must be Humanities.
Which two logical functions achieve the goal? Choose two.
A. IF [Subject]- 'Science' THEN 'Sciences' ELSEIF [Subject]='English' THEN 'Humanities' ELSEIF [Subject]-'Social Studies' THEN 'Humanities' ELSEIF [Subject]= 'Computer Science' THEN 'Sciences' END
B. IIF(( CONTAINS ([Subject], 'Science') = TRUE) , 'Humanities', 'Sciences')
C. IF ENDSWITH ( [Subject], 'Computer Science') THEN 'Sciences' ELSE 'Humanities' END
D. CASE [Subject] WHEN 'Computer Science' THEN 'Sciences' WHEN 'Science' THEN 'Sciences' WHEN 'English' THEN 'Humanities' WHEN 'Social Studies' THEN 'Humanities' End -
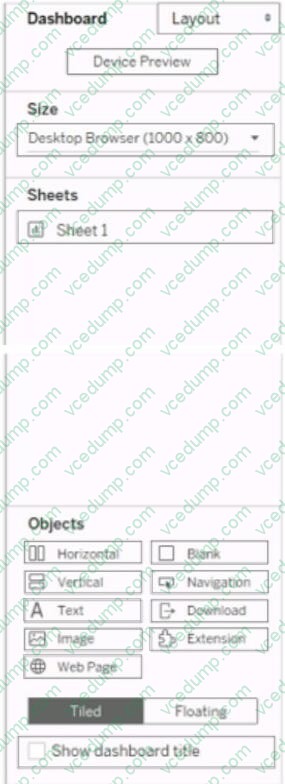
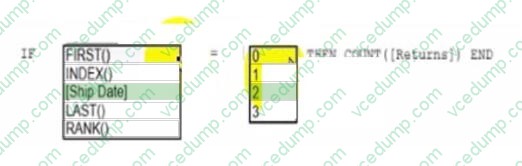
Question 83:
HOTSPOT
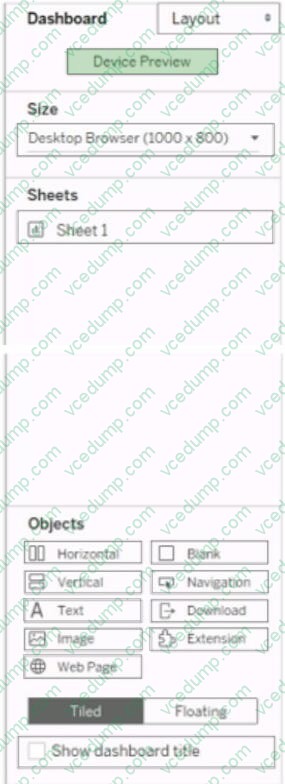
You have a dashboard that is configured for desktop browsers.
You want to customize a layout for mobile users.
Which option should you select first? (Click the appropriate Option in the Answer Area.)
-
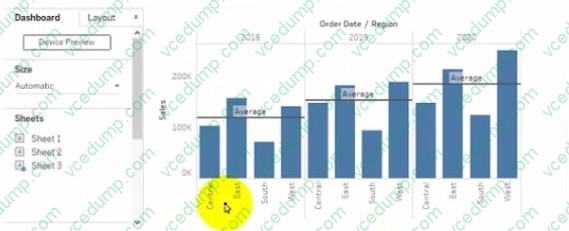
Question 84:
Refer to the exhibit.
You need the top 10 values to appear in a different color. The lop 10 values must be colored dynamically.
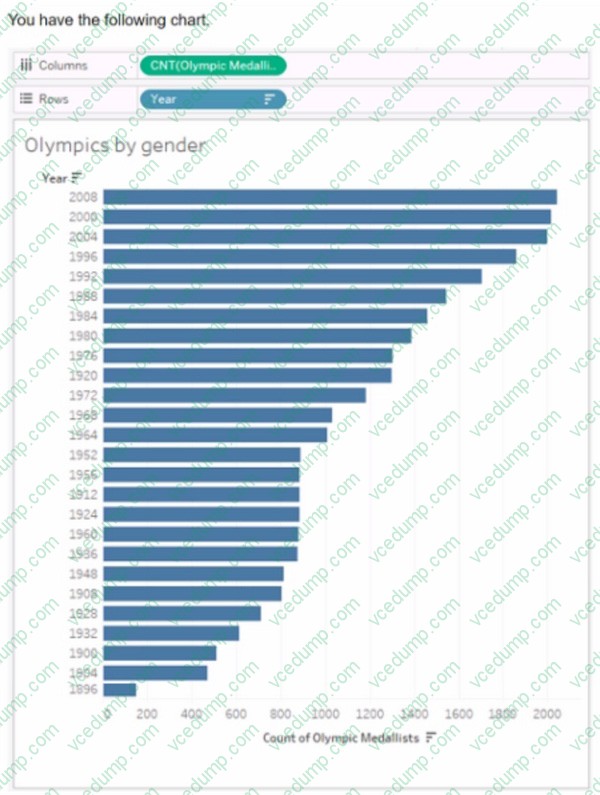
What should you do?
A. Select the lop 10 bars, create a set. and then drag the set to Color on the Marks card.
B. Create a group field that groups the top 10 values into one group and the rest of the values into another group. Drag the group field to Color on the Marks card.
C. Select the top 10 bars, and then change the color by selecting Color on the Marks card.
D. Create a set that has a top 10 condition, and then drag the set to Color on the Marks card. -
Question 85:
You are the owner of an alert.
You receive an email notification that the alert was suspended
From where can you resume the suspended alert?
A. The Data Source page of Tableau Desktop
B. The Notification area of Tableau Prep
C. The My Content area of Tableau web pages
D. The Shared with Ma page -
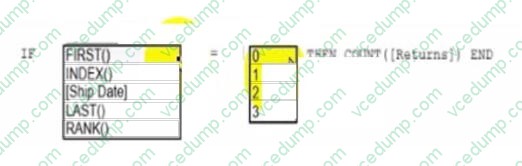
Question 86:
HOTSPOT
You have the following visualization.
-
Question 87:
You have a Tableau workbook that contain three worksheets named Sheet1 Sheet2 and Sheet3. You create several filters.
From the Data Source page you plan to add data source fillers When type of filter will appear in the Edit Data Source Filters dialog box?
A. A table calculation filter used on Sheet
B. A top N condition filer on a dimension in Sheet 1 and Sheet2
C. A context filler on a dimension m Sheet3
D. A dimension Maw on all the sheets -
Question 88:
You are subscribed to several views.
You need to unsubscribe from the views. What should you use?
A. The My Content area of Tableau web pages
B. The Notifications area of Tableau Prep
C. The Data Source page of Tableau Desktop
D. The Shared with Me page -
Question 89:
You have the following tiled dashboard that has one sheet.
You want to replace fit sheet with Sheet2. What should you do?
A. Right-click Sheet2 and select Add to Dashboard.
B. Select Sheets and click the Swap Sheet button next to Sheet2.
C. From the context menu of Sheet3. select Remove Dashboard item
D. Drag Sheet2 to the dashboard.
E. From the context menu of Sheet3. select Deselect -
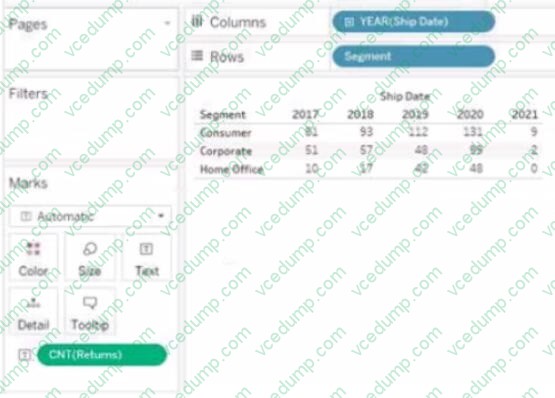
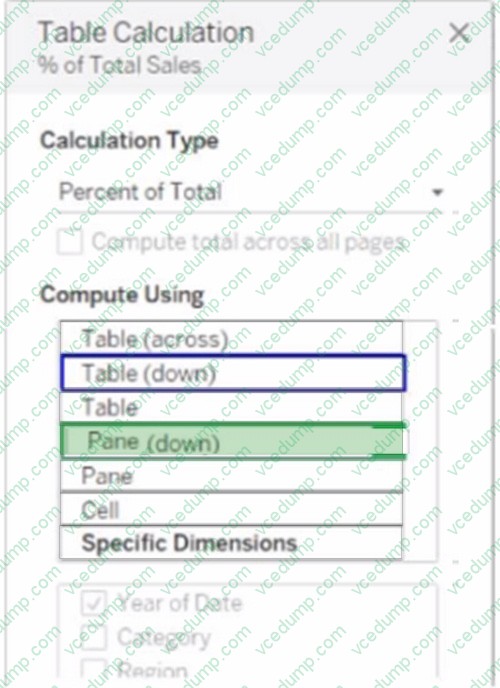
Question 90:
HOTSPOT
You have a data source that contains the following columns.
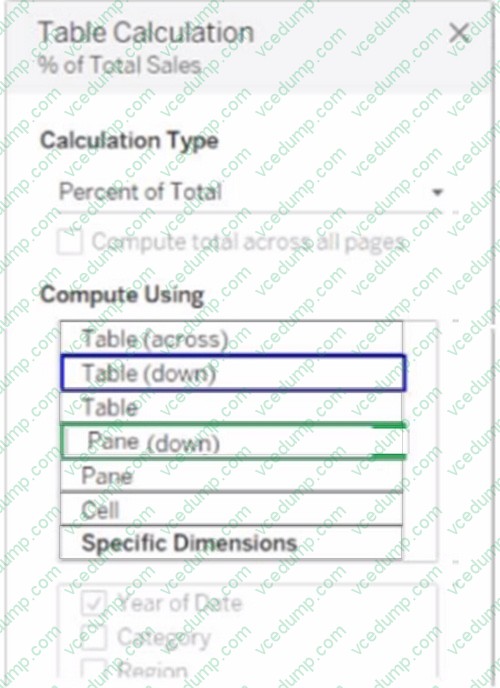
You have the following view that shows the percentage of total sales by category:
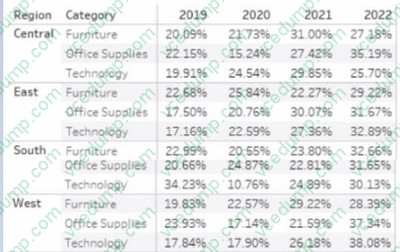
You want to change the calculation to show the percentage of total sales within the categories of every region annually. Which Compute Using option should you use? (Click the appropriate Option in the Answer Area.)
Tips on How to Prepare for the Exams
Nowadays, the certification exams become more and more important and required by more and more enterprises when applying for a job. But how to prepare for the exam effectively? How to prepare for the exam in a short time with less efforts? How to get a ideal result and how to find the most reliable resources? Here on Vcedump.com, you will find all the answers. Vcedump.com provide not only Tableau exam questions, answers and explanations but also complete assistance on your exam preparation and certification application. If you are confused on your TDA-C01 exam preparations and Tableau certification application, do not hesitate to visit our Vcedump.com to find your solutions here.