TDA-C01 Real Exam Questions

Tableau Certified Data Analyst

117 questions available · Page 1 of 12

Updated Exam DumpsVerified AnswersPass Guarantee

Get Complete Exam Dumps
Question 1 Hotspot

HOTSPOT

You have a dashboard than contains two sheets named Sheet 1 and Sheet 2.

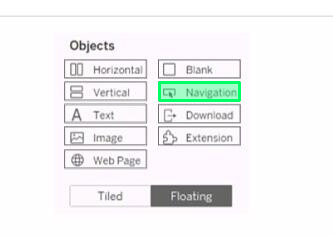
You want to add an object to the dashboard that users can click to switch to a different dashboard in the workbook.

Which object should you add to the dashboard?
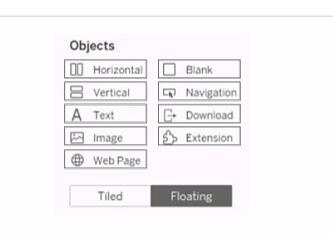
Question diagram
Show answer and explanation
Correct answer diagram
Explanation

The object that you should add to the dashboard to allow users to switch to a different dashboard in the workbook is Navigation.
Navigation objects are used to create links between dashboards or sheets in a workbook. You can add a navigation object to a dashboard by dragging it from the list of objects and dropping it on the dashboard.
You can then configure the navigation object to specify the destination dashboard or sheet that you want users to navigate to when they click on it. You can learn more about navigation objects and how to use them in this article:
https://help.tableau.com/current/pro/desktop/en-us/dashboards_navigation.htm
Question 2 Single choice

You want to create the following dashboard that will contain two sheets.

What should you do?

  1. A

    Drag both sheets to the dashboard and add a border to each sheet.

  2. B

    Drag both sheets to the dashboard and add a background lo each sheet.

  3. C

    Add both sheets lo a horizontal container and add a border to the container.

  4. D

    Add a border to both sheets and add both sheets to a horizontal object.

Show answer and explanation

Correct answer: C

Question 3 Single choice

Refer to the exhibit.

You need the top 10 values to appear in a different color. The lop 10 values must be colored dynamically.

What should you do?

  1. A

    Select the lop 10 bars, create a set. and then drag the set to Color on the Marks card.

  2. B

    Create a group field that groups the top 10 values into one group and the rest of the values into another group. Drag the group field to Color on the Marks card.

  3. C

    Select the top 10 bars, and then change the color by selecting Color on the Marks card.

  4. D

    Create a set that has a top 10 condition, and then drag the set to Color on the Marks card.

Show answer and explanation

Correct answer: D

Question 4 Single choice

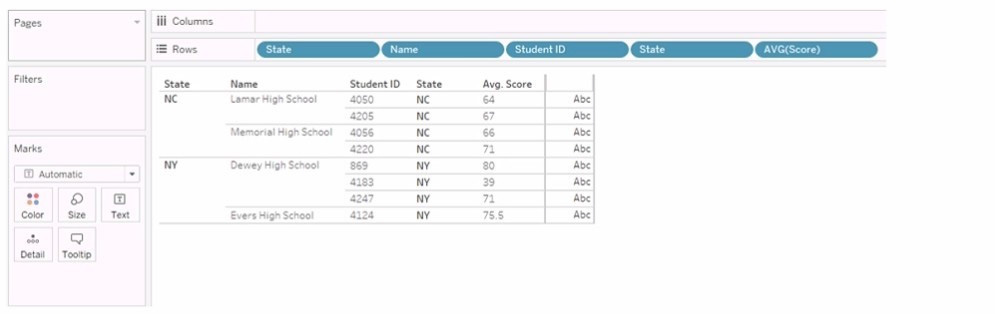
You have the following visualization.

You Create a table calculation named Rank_Score that has a formula of RANK(AVG([Score]), and you drag Rank_Score to Text on the Marks cards.

What is the Rank Score value for Student ID 4220?

  1. A

    5

  2. B

    4

  3. C

    6

  4. D

    3

Show answer and explanation

Correct answer: C

Explanation

To determine the Rank Score value for Student ID 4220, we look at the visualization provided and apply the table calculation of RANK(AVG([Score])). This function will rank the average scores in ascending order by default, with the lowest score receiving the rank of 1.
Based on the provided visualization, the scores for the students are as follows (from lowest to highest average score): Student ID 4183: 39 (Rank 1)
Student ID 4220: 71 (Rank 6)
Student ID 4247: 71 (Rank 6, same score as ID 4220 so they share the same rank)
Student ID 4124: 75.5
Student ID 4050: 64

Student ID 4205: 67
Student ID 4056: 66
Since Student ID 4220 has an average score of 71, which is the third-highest score, it shares the rank with Student ID 4247. However, since Tableau ranks without gaps, the actual rank assigned is 6, considering that there are two students with a rank of 4 (due to the same average score being the second lowest), making the next rank number 6. Note: The actual ranks for the highest scores are not provided, but they are not needed to determine the rank for Student ID 4220.

https://help.tableau.com/current/prep/en-us/prep_calculations.htm

Question 5 Multiple choice

You have a workbook that connects to a database. The database requires authentication.

You plan to publish the workbook and schedule a daily refresh of the data.

Which two conditions must be met to schedule the refresh? Choose two.

  1. A

    The credentials must be embedded.

  2. B

    The data source must be stored as a hyper file.

  3. C

    The data source must use a live connection.

  4. D

    The data must be extracted.

Show answer and explanation

Correct answers: A, D

Explanation

To schedule a refresh of the data, you need to ensure that Tableau Server or Tableau Online can access the database without prompting for credentials. This can be done by embedding the credentials in the workbook or the published data source. You also need to extract the data from the database and publish it as a separate data source or as part of the workbook. A live connection would not allow you to refresh the data on a schedule, as it would always query the database directly. A hyper file is a format for storing extracted data, but it is not a requirement for scheduling a refresh.
References:
Tableau Certified Data Analyst Exam Prep Guide, page 10, section "Publishing and Scheduling Data Refreshes"
Tableau Help: Embedding Database Credentials
Tableau Help: Extract Your Data

Question 6 Multiple choice

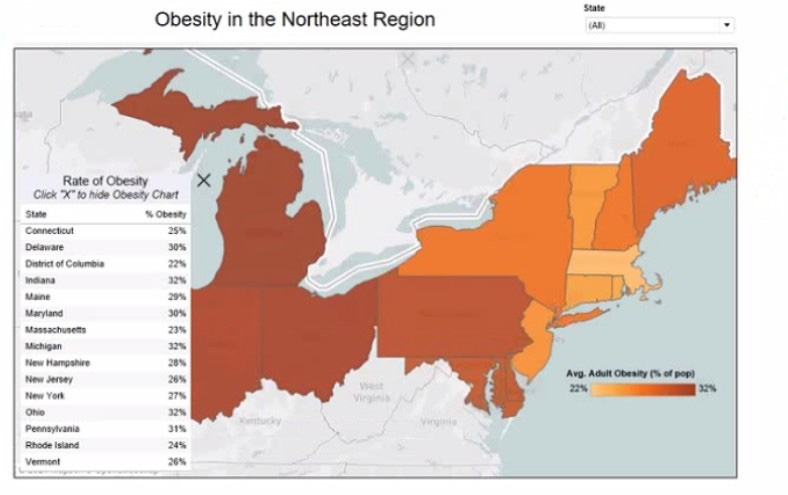
You have the Mowing dashboard.

Which two elements are floating? Choose two.

  1. A

    The state filter

  2. B

    The color legend

  3. C

    The map

  4. D

    The Rate of Obesity chart

  5. E

    The little

Show answer and explanation

Correct answers: A, D

Explanation

In Tableau dashboards, floating elements are those that can be freely moved over the dashboard canvas without being snapped into the tiled layout. The floating elements are often indicated by their standalone frames and the ability to overlap with other dashboard items. From the provided image, the state filter and the Rate of Obesity chart can be identified as floating if they can be moved independently of the tiled grid layout that constrains other elements.

Question 7 Single choice

In a dataset, you have a string field named Name that contains unnecessary semicolons.

Which function should you use to remove the semicolons from the Name field?

  1. A

    TRIM

  2. B

    CONTAINS

  3. C

    REPLACE

  4. D

    SPLIT

Show answer and explanation

Correct answer: C

Explanation

The REPLACE function is used to replace all occurrences of a substring within a string with another substring. In this case, it can be used to remove the semicolons from the Name field by replacing them with an empty string. For example, REPLACE ("John;Doe", ";", "") = "JohnDoe".
References:
The
information is based on the following sources: String Functions - Tableau Remove special characters and add a semi colon in a word - Tableau

Question 8 Single choice

You publish a dashboard tut uses an attract. The extract refreshes every Monday at 10:00.

You need to ensure that the extract also refreshes on the last day of the month at 18:00.

What should you do?

  1. A

    From Tableau Desktop, open the Publish Workbook dialog box and configure the schedule.

  2. B

    From Tableau Server select the workbook select Refresh Extracts and then add a new extract refresh

  3. C

    From Tableau Server. select Schedules find the schedule of the extract, and change the frequency to the Last day of the month

  4. D

    From Tableau Server. select Schedules and change the priority of the existing schedule

Show answer and explanation

Correct answer: C

Explanation

To ensure that the extract also refreshes on the last day of the month at 18:00, you need to add a new extract refresh task to the workbook on Tableau Server. You can do this by selecting the workbook, selecting Refresh Extracts, and then choosing Schedule a Refresh. You can then select an existing schedule that matches your desired frequency and time, or create a new schedule with a custom frequency and time. This will add a new extract refresh task to the workbook, in addition to the existing one that refreshes every Monday at 10:00. You can also modify or delete the extract refresh tasks as needed.

References:
Tableau Certified Data Analyst Exam Prep Guide, page 10, section "Publishing and Scheduling Data Refreshes"
Tableau Help: Refresh Data on a Schedule Tableau Help: Manage Refresh Tasks

Question 9 Multiple choice

in which three formats can you export a worksheet from the Worksheet menu? Choose three

  1. A

    .png

  2. B

    .html

  3. C

    .xlsx

  4. D

    .txt

  5. E

    .pptx

  6. F

    .csv

Show answer and explanation

Correct answers: A, C, E

Explanation

Tableau provides various options to export data from a worksheet. The formats available are typically those that are best suited for visualization or further data analysis. The options include:

.png for exporting images of the visualizations.xlsx for exporting data in a format that can be opened with Microsoft Excel
.pptx for creating PowerPoint presentations with the visualization embedded

These formats are designed to facilitate sharing and presenting the insights derived from Tableau visualizations, or for conducting further analysis in tools like Excel.

Question 10 Fill in the blank

CORRECT TEXT

Open the link to Book1 found on the desktop. Open the sales dashboard.

Add the Sales by State sheet in a Show/Hide button to the right side of the dashboard.

A. Check the steps below in explanation.

Show answer and explanation

Accepted answer: A

Explanation

To add the Sales by State sheet in a Show/Hide button to the right side of the dashboard, you need to do the following steps: Open the link to Book1 found on the desktop. This will open the Tableau workbook that contains the sales dashboard.
Click on the sales dashboard tab at the bottom of the workbook to open the dashboard. You will see a dashboard that shows various charts and filters related to sales data.
Drag Sales by State from the Sheets pane to the right side of the dashboard. This will add the sheet as a floating element on the dashboard. You can resize and position it as you like.
Right-click on Sales by State and select Add Show/Hide Button from the menu.
This will add a button that allows you to show or hide the sheet on the dashboard.

You can customize the appearance and behavior of the button by clicking on it and using the options on the Marks card.
Optionally, you can drag a vertical layout container from the Objects pane to the right side of the dashboard and place Sales by State and its button inside it. This will help you organize your dashboard elements and align them neatly.

References:
https://help.tableau.com/current/pro/desktop/en-us/dashboards.htm
https://help.tableau.com/current/pro/desktop/en-us/dashboards_showhide.htm
https://help.tableau.com/current/pro/desktop/en-us/dashboards_create_layouts.htm