PL-300 Exam Details
-
Exam Code
:PL-300 -
Exam Name
:Microsoft Power BI Data Analyst -
Certification
:Microsoft Certifications -
Vendor
:Microsoft -
Total Questions
:546 Q&As -
Last Updated
:Jul 15, 2026
Microsoft PL-300 Online Questions & Answers
-
Question 521:
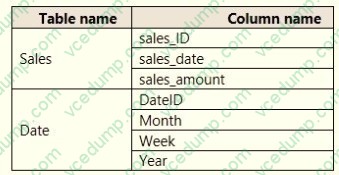
You have a sales system that contains the tables shown in the following table.
The Date table is marked as a date table.
DatelD is the date data type. You need to create an annual sales growth percentage measure.
Which DAX expression should you use?
A. SUM(sales[sales_amount]) - CALCULATE(SUM(sales[sales_amount]), SAMEPERIODLASTYEAR('Date'[DateID])
B. (SUM(`Sales'[sales_amount]) - CALCULATE(SUM(`Sales'[sales_amount]), SAMEPERIODLASTYEAR(`Date'[DateID]))) / CALCULATE(SUM(`Sales'[sales_amount]), SAMEPERIODLASTYEAR(`Date'[DateID]))
C. CALCULATE(SUM(sales[sales_amount]), DATESYTD(`Date'[DateID]))
D. CALCULATE(SUM(sales[sales_amount]), SAMEPERIODLASTYEAR(`Date'[DateID])) -
Question 522:
DRAG DROP
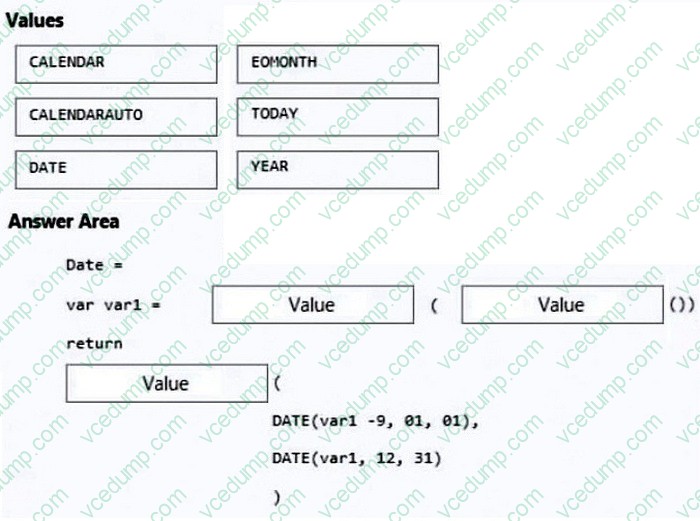
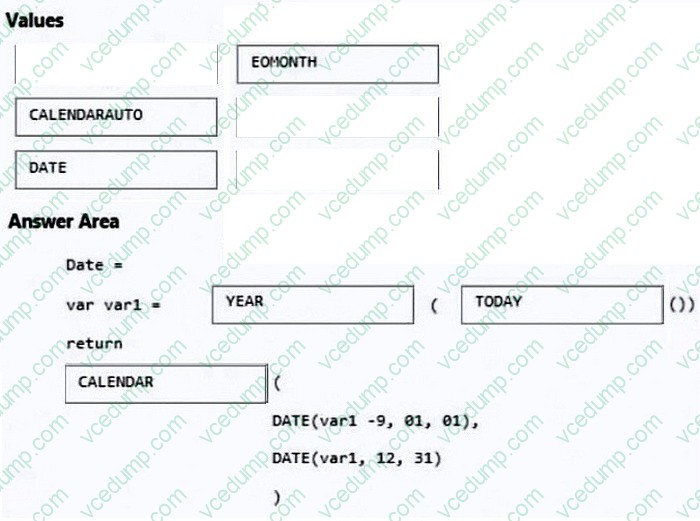
You need create a date table in Power BI that must contain 10 full calendar years, including the current year.
How should you complete the DAX expression? To answer, select the appropriate options in the answer area.
NOTE: Each correct selection is worth one point.
Select and Place:
-
Question 523:
Note: This question is part of a series of questions that present the same scenario. Each question in the series contains a unique solution that might meet the stated goals. Some question sets might have more than one correct solution, while others might not have a correct solution.
After you answer a question in this section, you will NOT be able to return to it. As a result, these questions will not appear in the review screen.
You create a parameter named DataSourceExcel that holds the file name and location of a Microsoft Excel data source.
You need to update the query to reference the parameter instead of multiple hard-coded copies of the location within each query definition.
Solution: You create a new query that references DataSourceExcel.
Does this meet the goal?
A. Yes
B. No -
Question 524:
You have a Power B1 semantic model named Model 1 that runs in import storage node.
You need to reduce the size of Model.
Which two action should you perform? Each connect answer presents a complete solution.
NOTE: Each correct selection is worth one point.
A. Summarize the detail data.
B. Change the active relationship between table to inactive relationship.
C. Optimize the column data types.
D. Upgrade to Power BI premium.
E. Implement row-level security (RLS). -
Question 525:
HOTSPOT
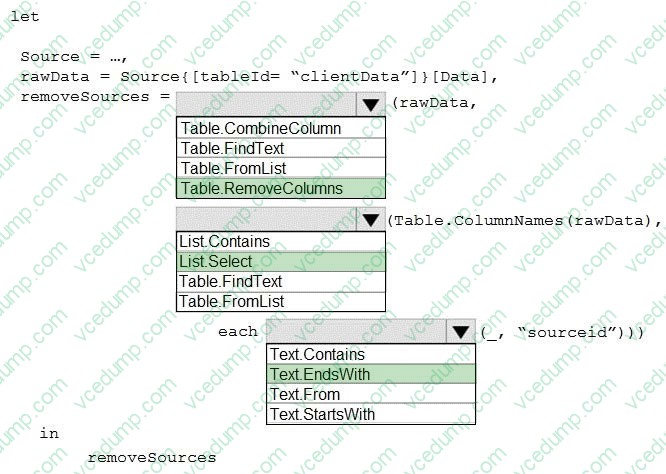
You have an API that returns more than 100 columns. The following is a sample of column names.
1. client_notified_timestamp
2. client_notified_source
3. client_notified_sourceid
4. client_notified_value
5. client_responded_timestamp
6. client_responded_source
7. client_responded_sourceid
8. client_responded_value
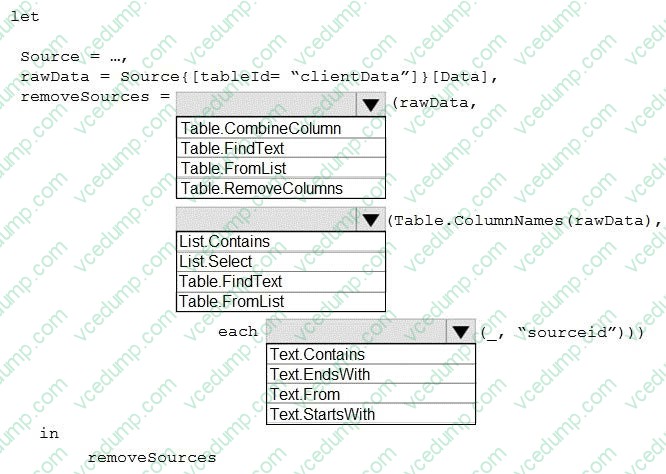
You plan to include only a subset of the returned columns. You need to remove any columns that have a suffix of sourceid.
How should you complete the Power Query M code? To answer, select the appropriate options in the answer area.
NOTE: Each correct selection is worth one point.
-
Question 526:
Vou plan to create a Power BI report that will be connected to multiple data sources. One of the data sources contains law records.
You need to ensure that other queries cannot access the tax record Information.
To what should you set Privacy Level for the data source?
A. None
B. Private
C. Organizational
D. Public -
Question 527:
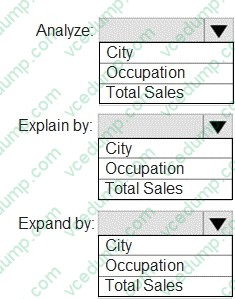
HOTSPOT
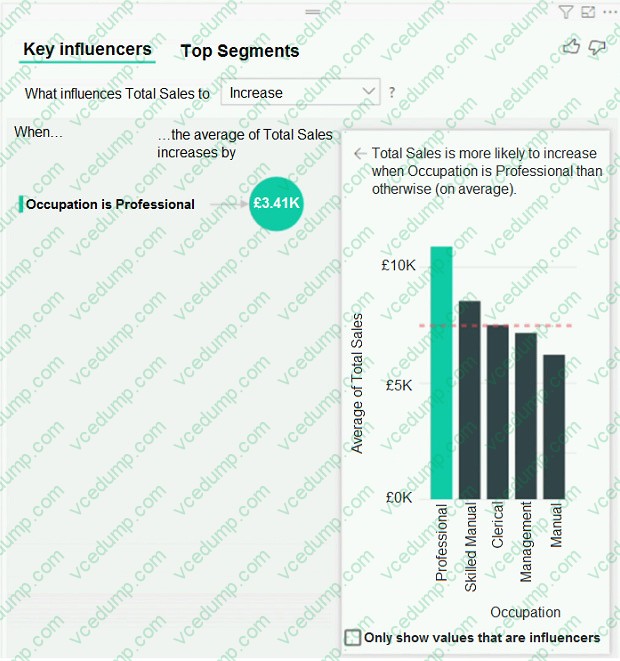
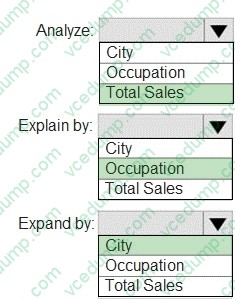
You have a table that contains the following three columns:
1. City
2. Total Sales
3. Occupation
You need to create a key influencers visualization as shown in the exhibit. (Click the Exhibit tab.)
How should you configure the visualization? To answer, select the appropriate options in the answer area.
NOTE: Each correct selection is worth one point.
-
Question 528:
You import a Power Bl dataset that contains the following tables:
1. Date
2. Product
3. Product Inventory
The Product inventory table contains 25 million rows. A sample of the data is shown in the following table.
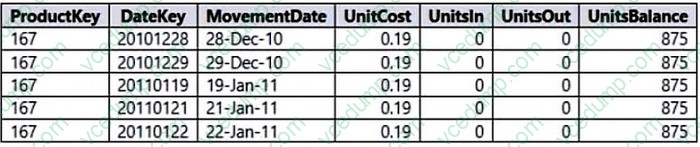
The Product Inventory table relates to the Date table by using the DateKey column.
The Product inventory table relates to the Product table by using the ProductKey column.
You need to reduce the size of the data model without losing information.
What should you do?
A. Change Summarization for DateKey to Don't Summarize.
B. Change the data type of UnitCost to Integer.
C. Remove the relationship between Date and Product Inventory.
D. Remove MovementDate. -
Question 529:
You have a Power BI semantic model that contains a table named Table1. Table1 contains the following columns:
1. WebsiteName
2. URL
You need to create a report named Report1 that will contain a table visual.
The solution must meet the following requirements:
1. Display the website name
2. Enable users to navigate to the website's URL by selecting the website name.
What should you use?
A. Inline hierarchy labels
B. Data categories
C. URL icons
D. Conditional Formatting -
Question 530:
DRAG DROP
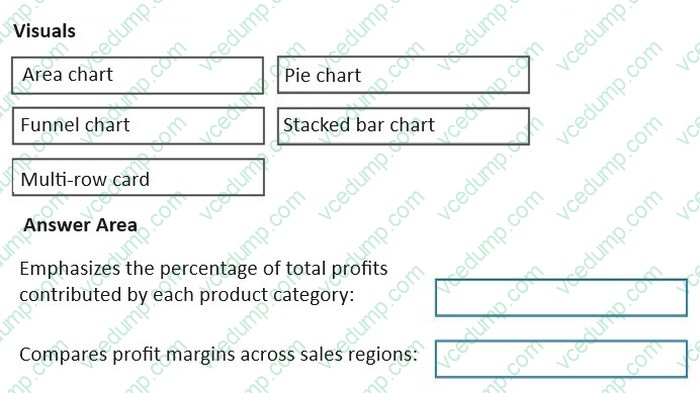
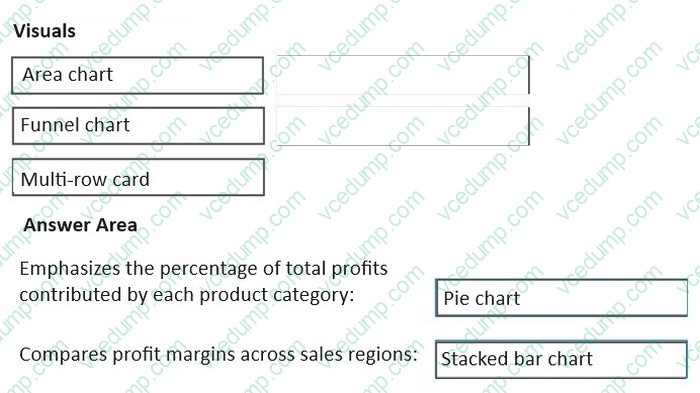
You plan to use Power BI to create a quarterly profit report that meets the following requirements:
1. Emphasizes the percentage of total profits contributed by each product category in dollars and as a percentage
2. Compares profit margins across sales regions
Which type of visual should you use for each requirement? To answer, drag the appropriate visuals to the correct requirements. Each visual may be used once, more than once, or not at all. You may need to drag the split bar between panes or scroll to view content.
NOTE: Each correct selection is worth one point.
Select and Place:
Related Exams:
-
62-193
Technology Literacy for Educators -
70-243
Administering and Deploying System Center 2012 Configuration Manager -
70-355
Universal Windows Platform – App Data, Services, and Coding Patterns -
77-420
Excel 2013 -
77-427
Excel 2013 Expert Part One -
77-725
Word 2016 Core Document Creation, Collaboration and Communication -
77-726
Word 2016 Expert Creating Documents for Effective Communication -
77-727
Excel 2016 Core Data Analysis, Manipulation, and Presentation -
77-728
Excel 2016 Expert: Interpreting Data for Insights -
77-731
Outlook 2016 Core Communication, Collaboration and Email Skills
Tips on How to Prepare for the Exams
Nowadays, the certification exams become more and more important and required by more and more enterprises when applying for a job. But how to prepare for the exam effectively? How to prepare for the exam in a short time with less efforts? How to get a ideal result and how to find the most reliable resources? Here on Vcedump.com, you will find all the answers. Vcedump.com provide not only Microsoft exam questions, answers and explanations but also complete assistance on your exam preparation and certification application. If you are confused on your PL-300 exam preparations and Microsoft certification application, do not hesitate to visit our Vcedump.com to find your solutions here.