PL-300 Exam Details
-
Exam Code
:PL-300 -
Exam Name
:Microsoft Power BI Data Analyst -
Certification
:Microsoft Certifications -
Vendor
:Microsoft -
Total Questions
:546 Q&As -
Last Updated
:Jul 15, 2026
Microsoft PL-300 Online Questions & Answers
-
Question 511:
DRAG DROP
You have a Power BI semantic model that contains two tables named Dim Location and Fact Deliveries. The relationships between the tables are configured as shown in the following table.

The model contains one measure that has the following formula.
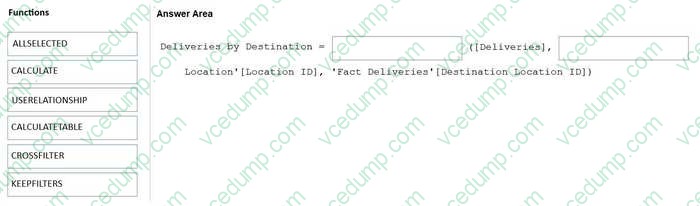
Deliveries = COUNTROWS('Fact Deliveries')
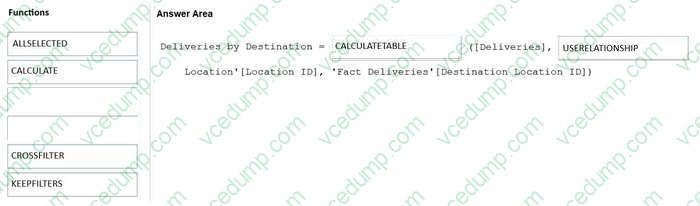
You need to create a new measure that counts the number of deliveries based on the destination location.
How should you complete the DAX expression? To answer, drag the appropriate functions to the correct targets. Each function may be used once, more than once, or not at all. You may need to drag the split bar between panes or scroll to view content.
NOTE: Each correct selection is worth one point.
Select and Place:
-
Question 512:
You have a dashboard that contains tiles pinned from a single report as shown in the Original Dashboard exhibit. (Click the Original Dashboard tab.)
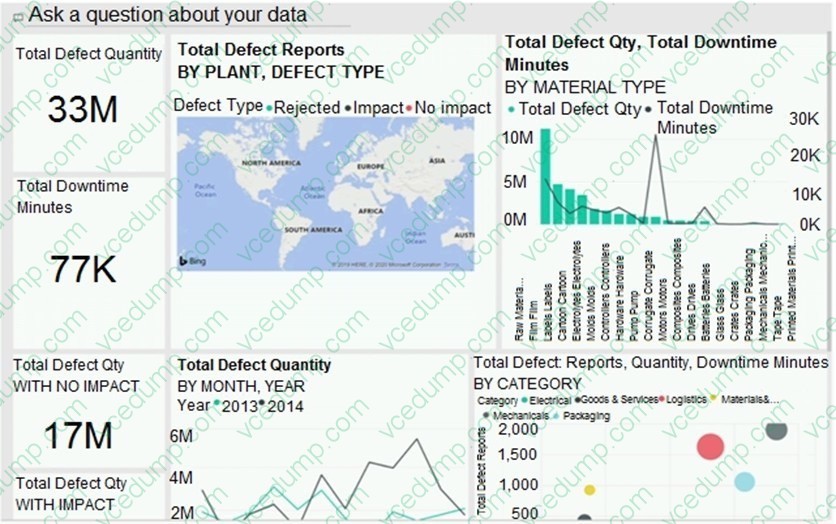
You need to modify the dashboard to appear as shown in the Modified Dashboard exhibit. (Click the Modified Dashboard tab.)
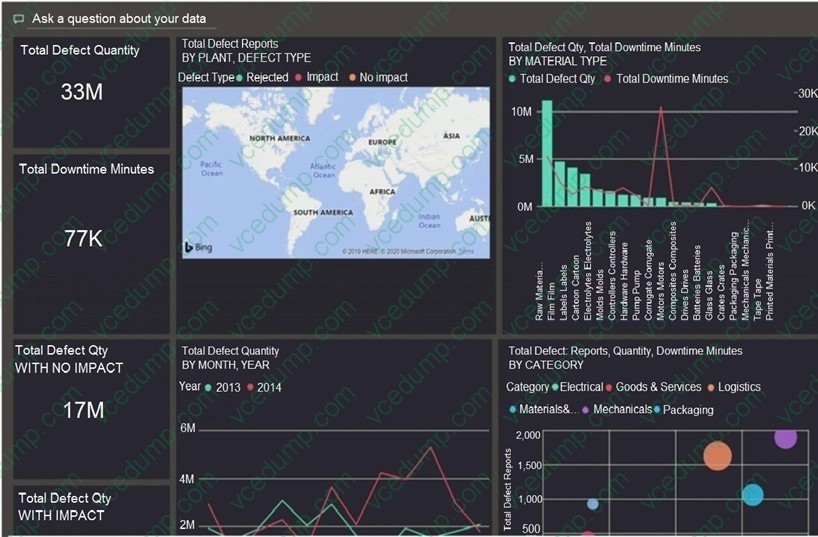
What should you do?
A. Edit the details of each tile.
B. Change the report theme.
C. Change the dashboard theme.
D. Create a custom CSS file. -
Question 513:
You have a Power Bl report
You have a table named Dalai that contains 10 million rows. Data is used in the following visuals:
1. A card that shows the number of records
2. A bar chart that snows total transaction amount by territory
3. A scatter plot that shows transaction amount and profit amount on the axes and points colored by territory
You need to modify the scatter plot to make it easier for users to identify meaningful patterns.
The solution must not affect the accuracy of the other visuals What should you do?
A. Apply a row filter to the Dalai query in Power Query Editor.
B. Add a trend line to the scatter plot
C. Enable high-density sampling on the scatter plot
D. Add a count field of the transaction amount to the size bucket of the scatter plot -
Question 514:
HOTSPOT
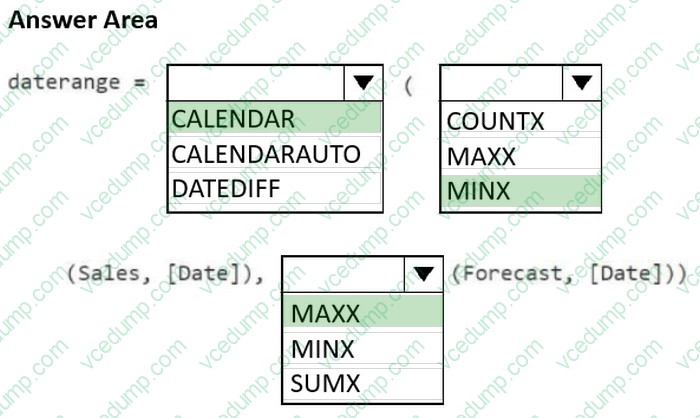
You have a Power BI semantic model that contains two tables named Sales and Forecast.
Both tables contain a date column.
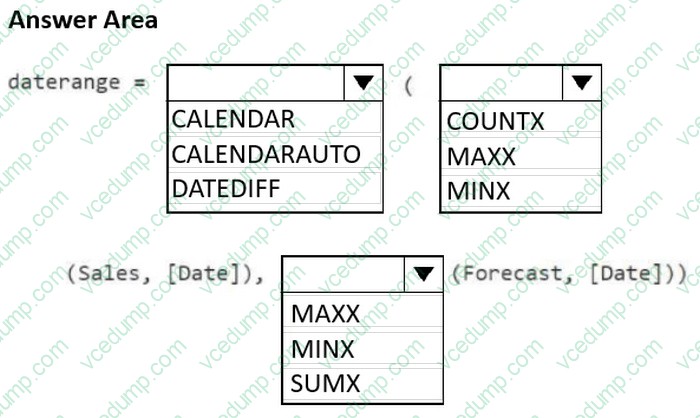
You need to create a calculated table that will cover the range of dates in both tables.
How should you complete the DAX expression? To answer, select the appropriate options in the answer area.
NOTE: Each correct selection is worth one point.
-
Question 515:
You have a Power Bl app that contains a report named Report1.
You add a new page to Report1.
You need to ensure that users can view the new page. The solution must minimize administrative effort.
What should you do?
A. Update the audience in the app
B. Update the app
C. Update the contact information in the app
D. Unpublish and create a new app -
Question 516:
You have a Power BI model that contains a table named Expenses. The table contains the following columns:
1. Date
2. Amount
3. Category
4. Expense ID
5. Employee ID
Expenses are recorded by employees, and each expense has a unique expense ID.
You need to create a DAX measure that will calculate the total amount of expenses.
Which DAX expression should you use?
A. Sum('Expenses'[Amount])
B. Max('Expenses'[Amount])
C. Sum('Expenses'[Expense ID])
D. Count('Expenses'[Amount]) -
Question 517:
HOTSPOT
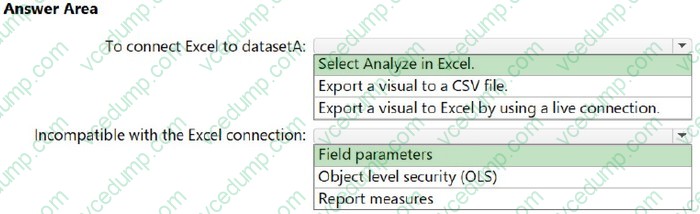
You have a Power BI tenant that contains a workspace. The workspace contains a dataset named datasetA.
You need to build a pivot table report in Microsoft Excel. The report must use datasetA as the data source. The solution must meet the following requirements:
1. Ensure that the report can be refreshed to get the latest available data from the Power BI service.
2. Ensure that all the visible data in datasetA is available for use in Excel.
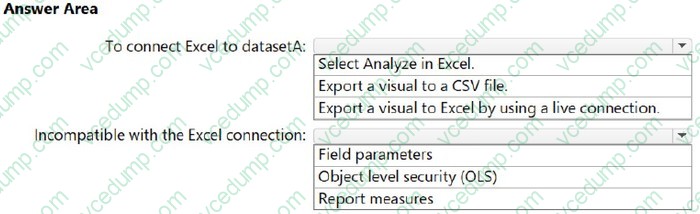
What should you do to connect Excel to datasetA, and which element in datasetA will be incompatible with the Excel connection? To answer, select the appropriate options in the answer area.
NOTE: Each correct selection is worth one point.
-
Question 518:
You have a semantic model that contains two tables named Sales and Date. The Sales table relates to the Date table by using a many-to-one relationship. The Sales table contains the following columns:
1. Date
2. Product
3. SalesAmount
You need to create a DAX measure for a rolling 31-day sales total that will return the total sales amount for a selected date and the previous 30 days.
Which DAX expression should you use?
A. CALCULATE(SUM(Sales[SalesAmount]), DATESBETWEEN(Date[Date], Max('Date'[Date])-30, Max('Date'[Date])))
B. CALCULATE(SUM(Sales[SalesAmount]), DATEADD(Date[Date], -36, DAY))
C. CALCULATE(SUM(Sales[SalesAmount]), DISTINCTCOUNT(Date[Date]) = 31)
D. CALCULATE(SUM(Sales[SalesAmount]), DATESMTD(Date[Date])) -
Question 519:
HOTSPOT
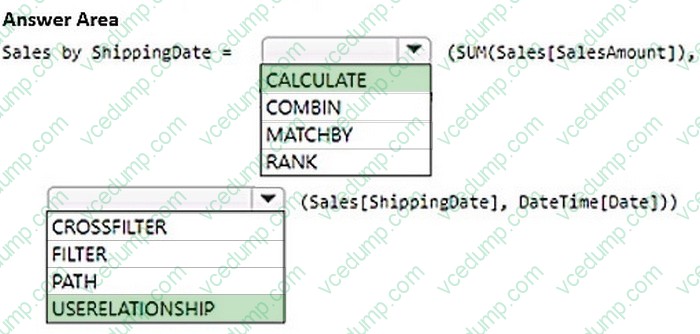
You have a semantic model named Model1 that contains the following tables
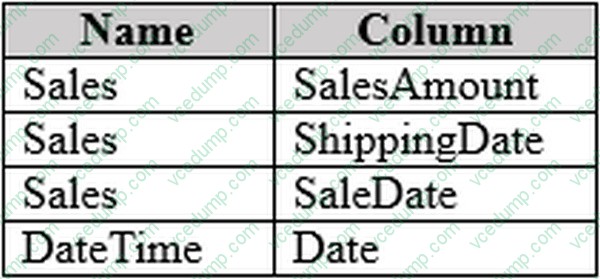
There is an active relationship between SaleDate and Date.
There is an inactive relationship between ShippingDate and Date-
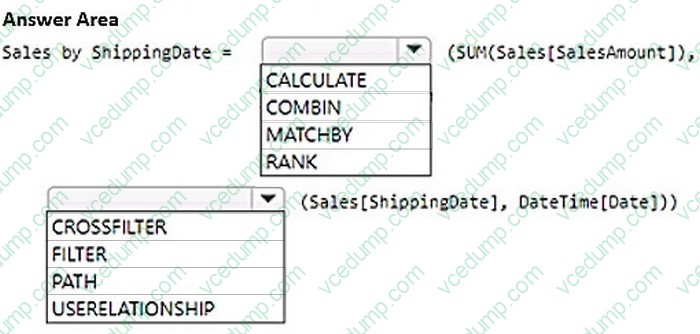
You need to create a new measure that will display the total amount of sales and support slicing by ShippingDate.
-
Question 520:
You have a Power BI report that contains a visual. The visual contains a measure.
You need to ensure that the report meets the following requirements:
1. All values must be set to two decimal places.
2. All negative values must be displayed in red font and parentheses.
Which two actions should you perform? Each correct answer presents part of the solution.
NOTE: Each correct selection is worth one point.
A. For the visual, apply conditional formatting to the background color.
B. Configure the measure to use a custom format.
C. For the visual, apply conditional formatting to the font color.
D. For the visual, set Value decimal places to 2.
Related Exams:
-
62-193
Technology Literacy for Educators -
70-243
Administering and Deploying System Center 2012 Configuration Manager -
70-355
Universal Windows Platform – App Data, Services, and Coding Patterns -
77-420
Excel 2013 -
77-427
Excel 2013 Expert Part One -
77-725
Word 2016 Core Document Creation, Collaboration and Communication -
77-726
Word 2016 Expert Creating Documents for Effective Communication -
77-727
Excel 2016 Core Data Analysis, Manipulation, and Presentation -
77-728
Excel 2016 Expert: Interpreting Data for Insights -
77-731
Outlook 2016 Core Communication, Collaboration and Email Skills
Tips on How to Prepare for the Exams
Nowadays, the certification exams become more and more important and required by more and more enterprises when applying for a job. But how to prepare for the exam effectively? How to prepare for the exam in a short time with less efforts? How to get a ideal result and how to find the most reliable resources? Here on Vcedump.com, you will find all the answers. Vcedump.com provide not only Microsoft exam questions, answers and explanations but also complete assistance on your exam preparation and certification application. If you are confused on your PL-300 exam preparations and Microsoft certification application, do not hesitate to visit our Vcedump.com to find your solutions here.