PL-300 Exam Details
-
Exam Code
:PL-300 -
Exam Name
:Microsoft Power BI Data Analyst -
Certification
:Microsoft Certifications -
Vendor
:Microsoft -
Total Questions
:546 Q&As -
Last Updated
:Jul 15, 2026
Microsoft PL-300 Online Questions & Answers
-
Question 501:
You are creating a new semantic model in Microsoft Power BI Desktop.
You connect to a recently used data source and receive an error message indicating that the password is expired.
You need to update the credentials for the data source.
What should you do?
A. From Data Source settings, select the data source, and then select Edit Permissions.
B. From Options, select Data Load, and then select Clear Cache.
C. From Power Query Editor, select Refresh Preview.
D. From the Modeling tab, select Manage Roles, and then add a role. -
Question 502:
You have a Power BI report that contains the visual shown in the following exhibit.
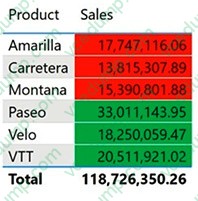
You need to make the visual more accessible to users who have color vision deficiency.
What should you do?
A. Change the font color of values in the Sales column to white.
B. Change the red background color to orange.
C. Add additional measures to the table values.
D. Add icons to represent the sales status of each product. -
Question 503:
HOTSPOT
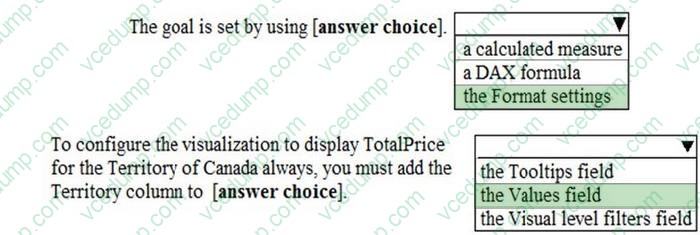
You have a report in Power BI Desktop as shown in the following exhibit.
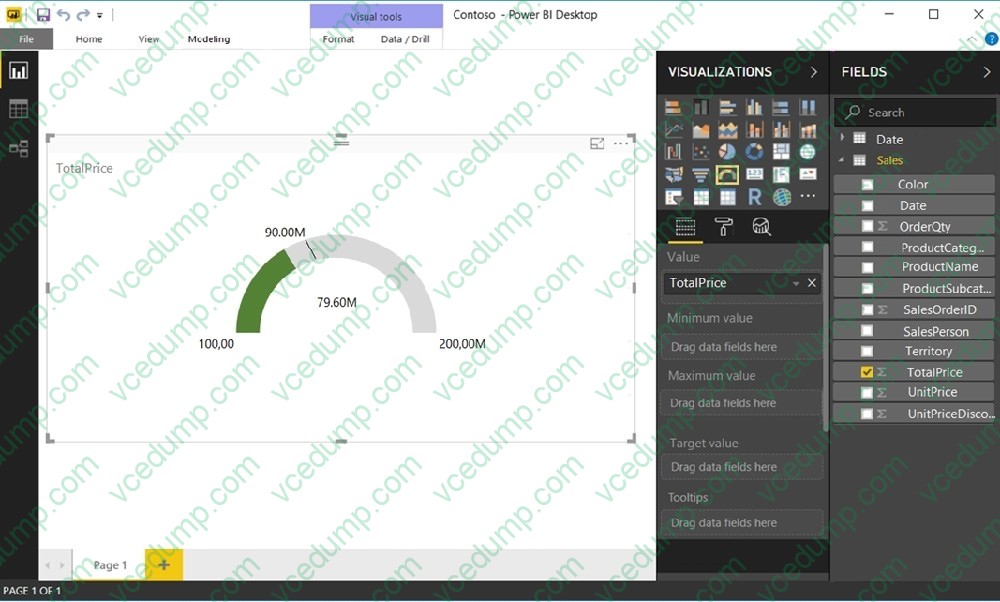
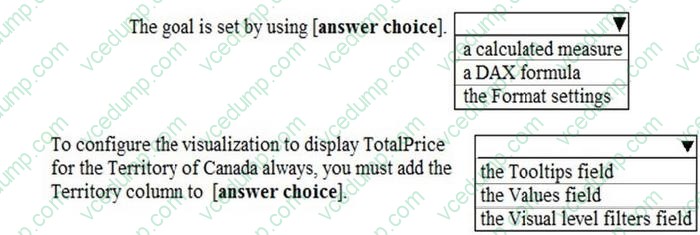
Use the drop-down menus to select the answer choice that completes each statement based on the information presented in the graphic.
Note: Each correct selection is worth one point.
-
Question 504:
You have a Power Bl report named Report1 and a dashboard named Dashboard1, Report1 contains a line chart named Sales by month.
You pin the Sales by month visual to Dashboard1.
In Report1, you change the Sales by month visual to a bar chart.
You need to ensure that bar chart displays on Dashboard1.
What should you do?
A. Edit the details for the dashboard tile of Dashboard1.
B. Select Refresh visuals for Dashboard1.
C. the Sales by month bar chart to Dashboard1
D. Refresh the dataset used by Report1 and Dashboard1. -
Question 505:
You have an Azure SQL database that contains sales transactions. The database is updated frequently.
You need to generate reports from the data to detect fraudulent transactions. The data must be visible within five minutes of an update.
How should you configure the data connection?
A. Add a SQL statement.
B. Set Data Connectivity mode to DirectQuery.
C. Set the Command timeout in minutes setting.
D. Set Data Connectivity mode to Import. -
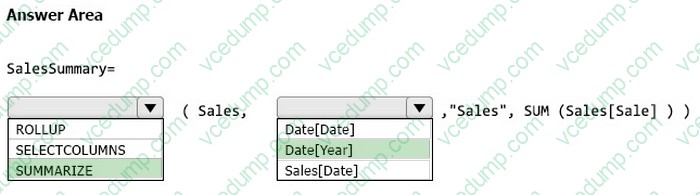
Question 506:
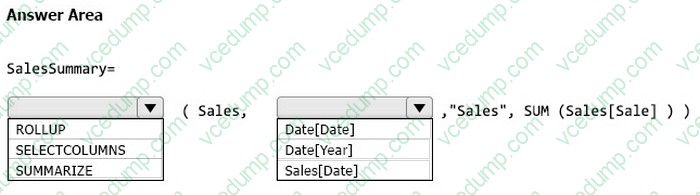
HOTSPOT
You have a Power BI model that contains the following data.
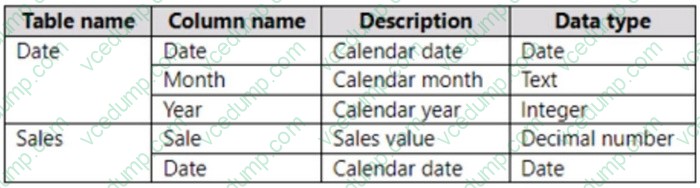
The Date table relates to the Sales table by using the Date columns.
You need to create a calculated table that will contain the following:
1. A row for each year
2. A column that contains the total sales per year
How should you complete the DAX calculation? To answer, select the appropriate options in the answer area.
NOTE: Each correct selection is worth one point.
-
Question 507:
You have a Power Bl report hosted on powerbi.com that displays expenses by department for department managers.
The report contains a line chart that shows expenses by month.
You need to enable users to choose between viewing the report as a line chart or a column chart. The solution must minimize development and maintenance effort.
What should you do?
A. Add a column chart, a bookmark, and a button for users to choose a visual.
B. Create a mobile report that contains a column chart.
C. Create a separate report page for users to view the column chart.
D. Enable report readers to personalize visuals. -
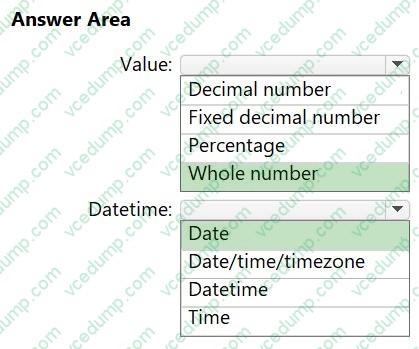
Question 508:
HOTSPOT
You use Power Query Editor to ingest data into Power BI Desktop.
The total dataset contains 250,000 rows. All the rows match the format of the data as shown in the following exhibit.
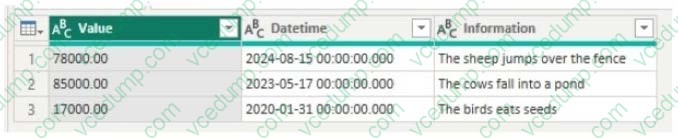
You need to optimize the data model size of the table.
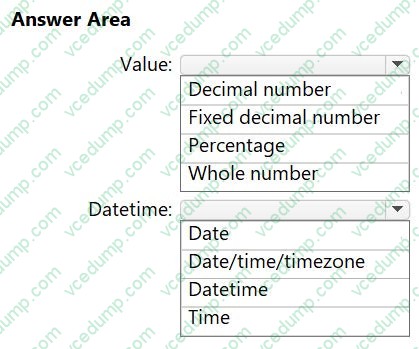
Which type of data should you use for the Value column and the Datetime column? To answer, select the appropriate options in the answer area.
NOTE: Each correct selection is worth one point.
-
Question 509:
Note: This question is part of a series of questions that present the same scenario. Each question in the series contains a unique solution that might meet the stated goals. Some question sets might have more than one correct solution, while others might not have a correct solution.
After you answer a question in this scenario, you will NOT be able to return to it. As a result, these questions will not appear in the review screen.
You have a clustered bar chart that contains a measure named Salary as the value and a field named Employee as the axis. Salary is present in the data as numerical amount representing US dollars.
You need to create a reference line to show which employees are above the median salary.
Solution: You create an average line by using the Salary measure.
Does this meet the goal?
A. Yes
B. No -
Question 510:
You have sales data in a star schema that contains four tables named Sales, Customer, Date, and Product. The Sales table contains purchase and ship dates.
Most often, you will use the purchase date to analyze the data, but you will analyze the data by both dates independently and together.
You need to design an imported dataset to support the analysis. The solution must minimize the model size and the number of queries against the data source.
Which data modeling design should you use?
A. Use the Auto Date/Time functionality in Microsoft Power Bl and do NOT import the Date table.
B. Duplicate the Date query in Power Query and create active relationships between Sales and both Date tables in the modeling view.
C. On the Date table, use a reference query in Power Query and create active relationships between Sales and both Date tables in the modeling view.
D. Import the Date table twice in Power Query and create active relationships between Sales and both Date tables in the modeling view.
Related Exams:
-
62-193
Technology Literacy for Educators -
70-243
Administering and Deploying System Center 2012 Configuration Manager -
70-355
Universal Windows Platform – App Data, Services, and Coding Patterns -
77-420
Excel 2013 -
77-427
Excel 2013 Expert Part One -
77-725
Word 2016 Core Document Creation, Collaboration and Communication -
77-726
Word 2016 Expert Creating Documents for Effective Communication -
77-727
Excel 2016 Core Data Analysis, Manipulation, and Presentation -
77-728
Excel 2016 Expert: Interpreting Data for Insights -
77-731
Outlook 2016 Core Communication, Collaboration and Email Skills
Tips on How to Prepare for the Exams
Nowadays, the certification exams become more and more important and required by more and more enterprises when applying for a job. But how to prepare for the exam effectively? How to prepare for the exam in a short time with less efforts? How to get a ideal result and how to find the most reliable resources? Here on Vcedump.com, you will find all the answers. Vcedump.com provide not only Microsoft exam questions, answers and explanations but also complete assistance on your exam preparation and certification application. If you are confused on your PL-300 exam preparations and Microsoft certification application, do not hesitate to visit our Vcedump.com to find your solutions here.