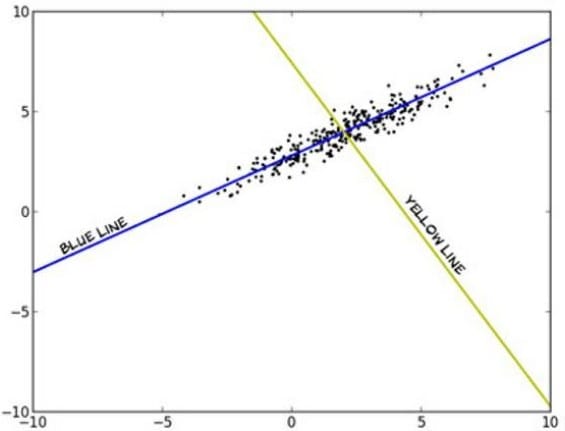
The figure below shows a plot of the data of a data matrix M that is 1000 x 2. Which line represents the first principal component?
A. yellow
B. blue
C. Neither
Correct Answer: B
Principal component analysis (PCA) involves a mathematical procedure that transforms a number of (possibly) correlated variables into a (smaller) number of uncorrelated variables called principal components. The first principal component accounts for as much of the variability in the data as possible, and each succeeding component accounts for as much of the remaining variability as possible. The first principal component corresponds to the greatest variance in the data. The blue line is evidently this first principal component, because if we project the data onto the blue line, the data is more spread out (higher variance) than if projected onto any other line, including the yellow one.
Question 72:
You are working in a classification model for a book, written by HadoopExam Learning Resources and decided to use building a text classification model for determining whether this book is for Hadoop or Cloud computing. You have to select the proper features (feature selection) hence, to cut down on the size of the feature space, you will use the mutual information of each word with the label of hadoop or cloud to select the 1000 best features to use as input to a Naive Bayes model. When you compare the performance of a model built with the 250 best features to a model built with the 1000 best features, you notice that the model with only 250 features performs slightly better on our test data.
What would help you choose better features for your model?
A. Include least mutual information with other selected features as a feature selection criterion
B. Include the number of times each of the words appears in the book in your model
C. Decrease the size of our training data
D. Evaluate a model that only includes the top 100 words
Correct Answer: A
Explanation: Correlation measures the linear relationship (Pearson's correlation) or monotonic relationship (Spearman's correlation) between two variables, X and Y. Mutual information is more general and measures the reduction of uncertainty in Y after observing X. It is the KL distance between the joint density and the product of the individual densities. So Ml can measure non-monotonic relationships and other more complicated relationships Mutual information is a quantification of the dependency between random variables. It is sometimes contrasted with linear correlation since mutual information captures nonlinear dependence. Features with high mutual information with the predicted value are good. However a feature may have high mutual information because it is highly correlated with another feature that has already been selected. Choosing another feature with somewhat less mutual information with the predicted value, but low mutual information with other selected features, may be more beneficial. Hence it may help to also prefer features that are less redundant with other selected features.
Question 73:
A denote the event 'student is female' and let B denote the event 'student is French'. In a class of 100 students suppose 60 are French, and suppose that 10 of the French students are females. Find the probability that if I pick a French student, it will be a girl, that is, find P(A|B).
A. 1/3
B. 2/3
C. 1/6
D. 2/6
Correct Answer: C
Explanation: Since 10 out of 100 students are both French and female, then P(AandB)=10100 Also. 60 out of the 100 students are French, so P(B)=60100 So the required probability is: P(A|B)=P(AandB)P(B)=10/10060/100=16
Question 74:
Under which circumstance do you need to implement N-fold cross-validation after creating a regression model?
A. The data is unformatted.
B. There is not enough data to create a test set.
C. There are missing values in the data.
D. There are categorical variables in the model.
Correct Answer: B
Question 75:
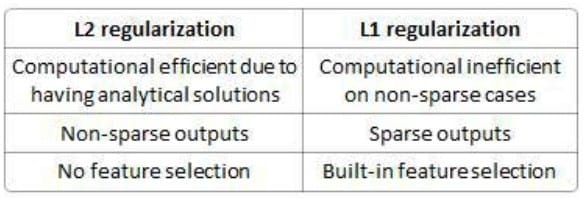
Select the correct option which applies to L2 regularization
A. Computational efficient due to having analytical solutions
B. Non-sparse outputs
C. No feature selection
Correct Answer: ABC
Explanation: :
The difference between their properties can be promptly summarized as follows:
Question 76:
Which of the following metrics are useful in measuring the accuracy and quality of a recommender system?
A. Cluster Density
B. Support Vector Count
C. Mean Absolute Error
D. Sum of Absolute Errors
Correct Answer: C
Explanation: The MAE measures the average magnitude of the errors in a set of forecasts, without considering their direction. It measures accuracy for continuous variables. The equation is given in the library references. Expressed in words,
the MAE is the average over the verification sample of the absolute values of the differences between forecast and the corresponding observation. The MAE is a linear score which means that all the individual differences are weighted equally
in the average. The sum of absolute errors is a valid metric, but doesn't give any useful sense of how the recommender system is performing.
Support vector count and cluster density do not apply to recommender systems. MAE and AUC are both valid and useful metrics for measuring recommender systems.
Question 77:
Which of the below best describe the Principal component analysis
A. Dimensionality reduction
B. Collaborative filtering
C. Classification
D. Regression
E. Clustering
Correct Answer: A
Question 78:
Select the sequence of the developing machine learning applications
A) Analyze the input data B) Prepare the input data C) Collect data D) Train the algorithm E) Test the algorithm F) Use It
A. A, B, C, D, E, F
B. C, B, A, D, E, F
C. C, A, B, D, E, F
D. C, B, A, D, E, F
Correct Answer: D
Explanation: 1 Collect data. You could collect the samples by scraping a website and extracting data: or you could get information from an RSS feed or an API. You could have a device collect wind speed measurements and send them to you, or blood glucose levels, or anything you can measure. The number of options is endless. To save some time and effort you could use publicly available data 2 Prepare the input data. Once you have this data, you need to make sure it's in a useable format. The format we'll be using in this book is the Python list. We'll talk about Python more in a little bit, and lists are reviewed in appendix A. The benefit of having this standard format is that you can mix and match algorithms and data sources. You may need to do some algorithm-specific formatting here. Some algorithms need features in a special format, some algorithms can deal with target variables and features as strings, and some need them to be integers. We'll get to this later but the algorithm-specific formatting is usually trivial compared to collecting data.
3 Analyze the input data. This is looking at the data from the previous task. This could be as simple as looking at the data you've parsed in a text editor to make sure steps 1 and 2 are actually working and you don't have a bunch of empty values. You can also look at the data to see if you can recognize any patterns or if there's anything obvious^ such as a few data points that are vastly different from the rest of the set. Plotting data in one: two, or three dimensions can also help. But most of the time you'll have more than three features, and you can't easily plot the data across all features at one time. You could, however use some advanced methods we'll talk about later to distill multiple dimensions down to two or three so you can visualize the data. 4 If you're working with a production system and you know what the data should look like, or you trust its source: you can skip this step. This step takes human involvement, and for an automated system you don't want human involvement. The value of this step is that it makes you understand you don't have garbage coming in. 5 Train the algorithm. This is where the machine learning takes place. This step and the next step are where the "core" algorithms lie, depending on the algorithm.You feed the algorithm good clean data from the first two steps andextract knowledge or information. This knowledge you often store in a formatthat's readily useable by a machine for the next two steps.In the case of unsupervised learning, there's no training step because youdon't have a target value. Everything is used in the next step. 6 Test the algorithm. This is where the information learned in the previous step isput to use. When you're evaluating an algorithm, you'll test it to see how well itdoes. In the case of supervised learning, you have some known values you can use to evaluate the algorithm. In unsupervised learning, you may have to use some other metrics to evaluate the success. In either case, if you're not satisfied, you can go back to step 4, change some things, and try testing again. Often thecollection or preparation of the data may have been the problem, and you'll have to go back to step 1. 7 Use it. Here you make a real program to do some task, and once again you see if all the previous steps worked as you expected. You might encounter some new data and have to revisit steps 1-5.
Question 79:
A. Logistic Regression
B. Support Vector Machine
C. Neural Network
D. Hidden Markov Models
E. None of the above
Correct Answer: E
Explanation: Logistic regression
Logistic regression is a model used for prediction of the probability of occurrence of an event. It makes use of several predictor variables that may be either numerical or categories.
Support Vector Machines
As with naive Bayes, Support Vector Machines (or SVMs) can be used to solve the task of assigning objects to classes. But the way this task is solved is completely different to the setting in naive Bayes.
Neural Network
Neural Networks are a means for classifying multidimensional objects.
Hidden Markov Models
Hidden Markov Models are used in multiple areas of machine learning, such as speech recognition, handwritten letter recognition, or natural language processing.
Question 80:
Select the choice where Regression algorithms are not best fit
A. When the dimension of the object given
B. Weight of the person is given
C. Temperature in the atmosphere
D. Employee status
Correct Answer: D
Explanation: Regression algorithms are usually employed when the data points are inherently numerical variables (such as the dimensions of an object the weight of a person, or the temperature in the atmosphere) but unlike Bayesian algorithms, they're not very good for categorical data (such as employee status or credit score description).
Nowadays, the certification exams become more and more important and required by more and more enterprises when applying for a job. But how to prepare for the exam effectively? How to prepare for the exam in a short time with less efforts? How to get a ideal result and how to find the most reliable resources? Here on Vcedump.com, you will find all the answers. Vcedump.com provide not only Databricks exam questions, answers and explanations but also complete assistance on your exam preparation and certification application. If you are confused on your DATABRICKS-CERTIFIED-PROFESSIONAL-DATA-SCIENTIST exam preparations and Databricks certification application, do not hesitate to visit our Vcedump.com to find your solutions here.