Regularization is a very important technique in machine learning to prevent over fitting. And Optimizing with a L1 regularization term is harder than with an L2 regularization term because
A. The penalty term is not differentiate
B. The second derivative is not constant
C. The objective function is not convex
D. The constraints are quadratic
Correct Answer: A
Explanation: Regularization is a very important technique in machine learning to prevent overfitting. Mathematically speaking, it adds a regularization term in order to prevent the coefficients to fit so perfectly to overfit. The difference between the L1 and L2 is just that L2 is the sum of the square of the weights, while L1 is just the sum of the weights. Much of optimization theory has historically focused on convex loss functions because they're much easier to optimize than non-convex functions: a convex function over a bounded domain is guaranteed to have a minimum, and it's easy to find that minimum by following the gradient of the function at each point no matter where you start. For non- convex functions, on the other hand, where you start matters a great deal; if you start in a bad position and follow the gradient, you're likely to end up in a local minimum that is not necessarily equal to the global minimum. You can think of convex functions as cereal bowls: anywhere you start in the cereal bowl, you're likely to roll down to the bottom. A non-convex function is more like a skate park: lots of ramps, dips, ups and downs. It's a lot harder to find the lowest point in a skate park than it is a cereal bowl.
Question 52:
Refer to exhibit
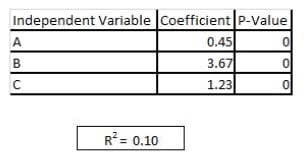
You are asked to write a report on how specific variables impact your client's sales using a data set provided to you by the client. The data includes 15 variables that the client views as directly related to sales, and you are restricted to these variables only. After a preliminary analysis of the data, the following findings were made: 1. Multicollinearity is not an issue among the variables 2. Only three variables-A, B, and C-have significant correlation with sales You build a linear regression model on the dependent variable of sales with the independent variables of A, B, and C. The results of the regression are seen in the exhibit. You cannot request additional data. what is a way that you could try to increase the R2 of the model without artificially inflating it?
A. Create clusters based on the data and use them as model inputs
B. Force all 15 variables into the model as independent variables
C. Create interaction variables based only on variables A, B, and C
D. Break variables A, B, and C into their own univariate models
Correct Answer: A
Explanation: In statistics, linear regression is an approach for modeling the relationship between a scalar dependent variable y and one or more explanatory variables (or independent variable) denoted X. The case of one explanatory variable is called simple linear regression. For more than one explanatory variable, the process is called multiple linear regression. (This term should be distinguished from multivariate linear regression^ where multiple correlated dependent variables are predicted, rather than a single scalar variable.) In linear regression data are modeled using linear predictor functions, and unknown model parameters are estimated from the data. Such models are called linear models. Most commonly, linear regression refers to a model in which the conditional mean of y given the value of X is an affine function of X. Less commonly: linear regression could refer to a model in which the median, or some other quantile of the conditional distribution of y given X is expressed as a linear function of X. Like all forms of regression analysis, linear regression focuses on the conditional probability distribution of y given X, rather than on the joint probability distribution of y and X: which is the domain of multivariate analysis.
Question 53:
Google Adwords studies the number of men, and women, clicking the advertisement on search engine during the midnight for an hour each day.
Google find that the number of men that click can be modeled as a random variable with distribution Poisson(X), and likewise the number of women that click as Poisson(Y).
What is likely to be the best model of the total number of advertisement clicks during the midnight for an hour ?
A. Binomial(X+Y,X+Y)
B. Poisson(X/Y)
C. Normal(X+Y(M+Y)1/2) D. Poisson(X+Y)
Correct Answer: D
Explanation: The total number of clicks is the sum of the number of men and women. The sum of two Poisson random variables also follows a Poisson distribution with rate equal to the sum of their rates. The Normal and Binomial distribution can approximate the Poisson distribution in certain cases, but the expressions above do not approximate Poisson(X+Y).
Question 54:
A. 2.4
B. 24 0
C. .24
D. .48
E. 4.8
Correct Answer: C
Explanation: Given no additional information, the MLE for the probability of an item in the test set is exactly its frequency in the training set. The method of maximum likelihood corresponds to many well-known estimation methods in statistics.
For example, one may be interested in the heights of adult female penguins, but be unable to measure the height of every single penguin in a population due to cost or time constraints. Assuming that the heights are normally (Gaussian)
distributed with some unknown mean and variance, the mean and variance can be estimated with MLE while only knowing the heights of some sample of the overall population. MLE would accomplish this by taking the mean and variance as
parameters and finding particular parametric values that make the observed results the most probable (given the model).
In general, for a fixed set of data and underlying statistical model the method of maximum likelihood selects the set of values of the model parameters that maximizes the likelihood function. Intuitively, this maximizes the "agreement" of the
selected model with the observed data, and for discrete random variables it indeed maximizes the probability of the observed data under the resulting distribution. Maximum-likelihood estimation gives a unified approach to estimation, which is
well-defined in the case of the normal distribution and many other problems. However in some complicated problems, difficulties do occur: in such problems, maximum-likelihood estimators are unsuitable or do not exist.
Question 55:
Suppose there are three events then which formula must always be equal to P(E1|E2,E3)?
A. P(E1,E2,E3)P(E1)/P(E2:E3)
B. P(E1,E2;E3)/P(E2,E3)
C. P(E1,E2|E3)P(E2|E3)P(E3)
D. P(E1,E2|E3)P(E3)
E. P(E1,E2,E3)P(E2)P(E3)
Correct Answer: B
Explanation: This is an application of conditional probability: P(E1,E2)=P(E1|E2)P(E2). so P(E1|E2) = P(E1.E2)/P(E2)
P(E1,E2,E3)/P(E2,E3)
If the events are A and B respectively, this is said to be "the probability of A given B" It is commonly denoted by P(A|B): or sometimes PB(A). In case that both "A" and "B" are categorical variables, conditional probability table is typically used
to represent the conditional probability.
Question 56:
A data scientist wants to predict the probability of death from heart disease based on three risk factors: age, gender, and blood cholesterol level. What is the most appropriate method for this project?
A. Linear regression
B. K-means clustering
C. Logistic regression
D. Apriori algorithm
Correct Answer: C
Explanation: Logistic regression is used widely in many fields, including the medical and social sciences. For example, the Trauma and Injury Severity Score (TRISS), which is widely used to predict mortality in injured patients, was originally developed by Boyd et al. using logistic regression. Many other medical scales used to assess severity of a patient have been developed using logistic regression. Logistic regression may be used to predict whether a patient has a given disease (e.g. diabetes; coronary heart disease), based on observed characteristics of the patient (age, sex, body mass index, results of various blood tests, etc.; age, blood cholesterol level, systolic blood pressure, relative weight, blood hemoglobin level, smoking (at 3 levels), and abnormal electrocardiogram.).Another example might be to predict whether an American voter will vote Democratic or Republican, based on age, income, sex, race, state of residence, votes in previous elections, etc. The technique can also be used in engineering, especially for predicting the probability of failure of a given process, system or product. It is also used in marketing applications such as prediction of a customer's propensity to purchase a product or halt a subscription, etc.[citation needed] In economics it can be used to predict the likelihood of a person's choosing to be in the labor force, and a business application would be to predict the likelihood of a homeowner defaulting on a mortgage. Conditional random fields, an extension of logistic regression to sequential data, are used in natural language processing.
Question 57:
Logistic regression is a model used for prediction of the probability of occurrence of an event. It makes use of several variables that may be......
A. Numerical
B. Categorical
C. Both 1 and 2 are correct
D. None of the 1 and 2 are correct
Correct Answer: C
Explanation: Logistic regression is a model used for prediction of the probability of occurrence of an event. It makes use of several predictor variables that may be either numerical or categories.
Question 58:
Which is an example of supervised learning?
A. PCA
B. k-means clustering
C. SVD
D. EM
E. SVM
Correct Answer: E
Explanation: SVMs can be used to solve various real world problems:
SVMs are helpful in text and hypertext categorization as their application can significantly reduce the need for labeled training instances in both the standard inductive and transductive settings.
Classification of images can also be performed using SVMs. Experimental results show that SVMs achieve significantly higher search accuracy than traditional query refinement schemes after just three to four rounds of relevance feedback.
SVMs are also useful in medical science to classify proteins with up to 90% of the compounds classified correctly.
Hand-written characters can be recognized using SVM
Question 59:
Which technique you would be using to solve the below problem statement? "What is the probability that individual customer will not repay the loan amount?"
A. Classification
B. Clustering
C. Linear Regression
D. Logistic Regression
E. Hypothesis testing
Correct Answer: D
Question 60:
What are the advantages of the mutual information over the Pearson correlation for text classification problems?
A. The mutual information has a meaningful test for statistical significance.
B. The mutual information can signal non-linear relationships between the dependent and independent variables.
C. The mutual information is easier to parallelize.
D. The mutual information doesn't assume that the variables are normally distributed.
Correct Answer: C
Explanation: A linear scaling of the input variables (that may be caused by a change of units for the measurements) is sufficient to modify the PCA results. Feature selection methods that are sufficient for simple distributions of the patterns belonging to different classes can fail in classification tasks with complex decision boundaries. In addition, methods based on a linear dependence (like the correlation) cannot take care of arbitrary relations between the pattern coordinates and the different classes. On the contrary, the mutual information can measure arbitrary relations between variables and it does not depend on transformations acting on the different variables. This item concerns itself with feature selection for a text classification problem and references mutual information criteria. Mutual information is a bit more sophisticated than just selecting based on the simple correlation of two numbers because it can detect non- linear relationships that will not be identified by the correlation. Whenever possible: mutual information is a better feature selection technique than correlation. Mutual information is a quantification of the dependency between random variables. It is sometimes contrasted with linear correlation since mutual information captures nonlinear dependence. Correlation analysis provides a quantitative means of measuring the strength of a linear relationship between two vectors of data. Mutual information is essentially the measure of how much "knowledge" one can gain of a certain variable by knowing the value of another variable.
Nowadays, the certification exams become more and more important and required by more and more enterprises when applying for a job. But how to prepare for the exam effectively? How to prepare for the exam in a short time with less efforts? How to get a ideal result and how to find the most reliable resources? Here on Vcedump.com, you will find all the answers. Vcedump.com provide not only Databricks exam questions, answers and explanations but also complete assistance on your exam preparation and certification application. If you are confused on your DATABRICKS-CERTIFIED-PROFESSIONAL-DATA-SCIENTIST exam preparations and Databricks certification application, do not hesitate to visit our Vcedump.com to find your solutions here.