Q62
Hotspot
HOTSPOT
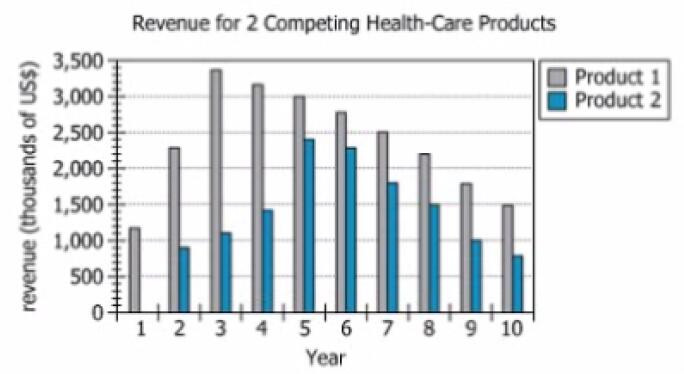
The graph shows the total annual revenue. In US dollars (US$), from sales of each of 2 competing health-care products for 10 consecutive years. Product 1 was first sold In Year 1, and Product 2 was first sold ki
Year 2.
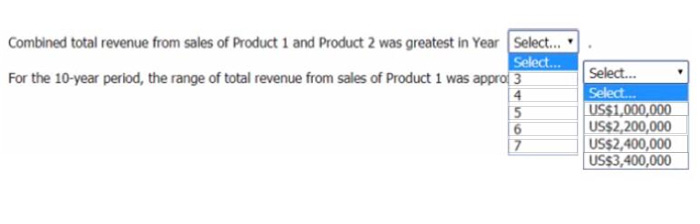
From each drop-down menu, select the option that creates the most accurate statement based on the
information provided.
Select the correct area(s) on the image.