Q24
Lab
Simulation
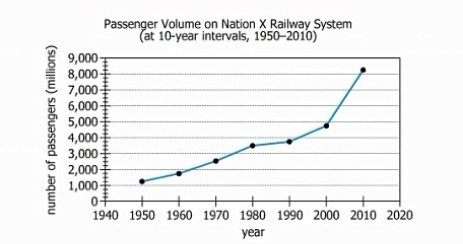
At 10-year intervals from 1950 through 2010, the graph shows the total number of passengers, in millions, on the railway system of Nation X. From each drop-down menu, select the option that creates the most accurate statement based on the information provided.

Not auto-scored - compare your configuration against the model answer.