Which two functionalities can you provide to consumers by adding a parameter to a visualization? (Choose two.)
Show answer and explanation
Correct answers: A, C
TDS-C01 Real Exam Questions
341 questions available · Page 1 of 35
Updated Exam DumpsVerified AnswersPass Guarantee
Which two functionalities can you provide to consumers by adding a parameter to a visualization? (Choose two.)
Correct answers: A, C
Which statement accurately describes adding a dashboard layout for a mobile device?
Correct answer: A
A correct portrait for mobile and landscape for tablet
You have the following visualization.
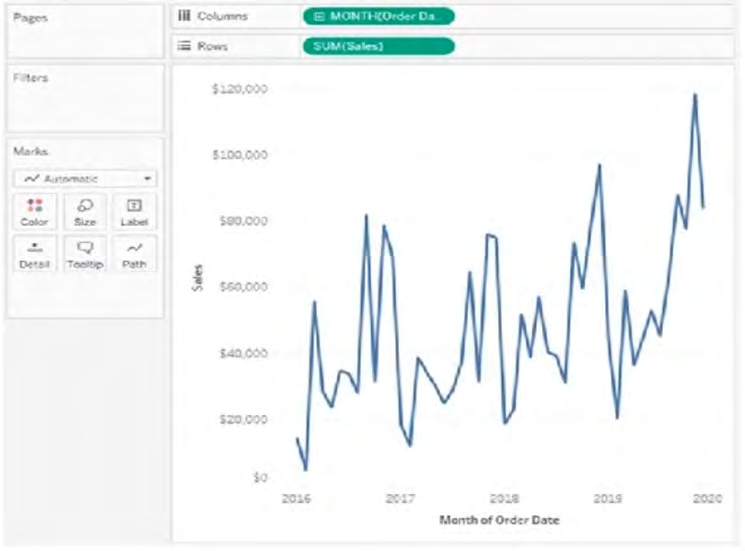
Where should you place a field named Region to show multiple distinct lines on the same axis?
Correct answer: B
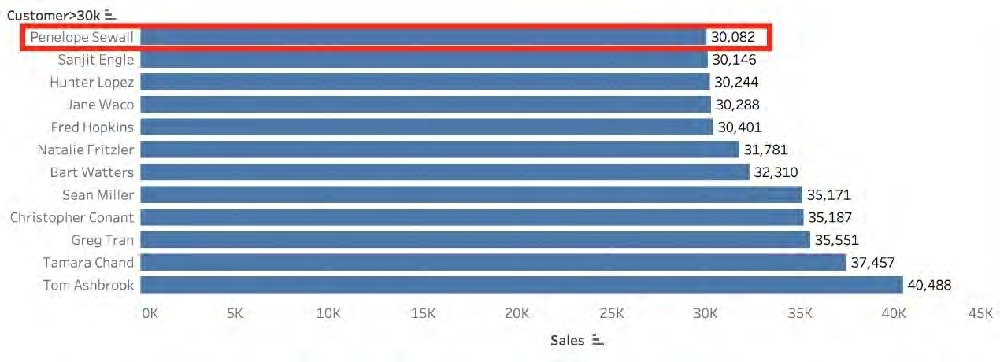
Create a Set containing Customer Names whose Sales are GREATER than 30,000.
Which customer had the LEAST sales in this set?
Correct answer: C
As the question mentions, we need to create a SET with the following conditions-> Choose only those
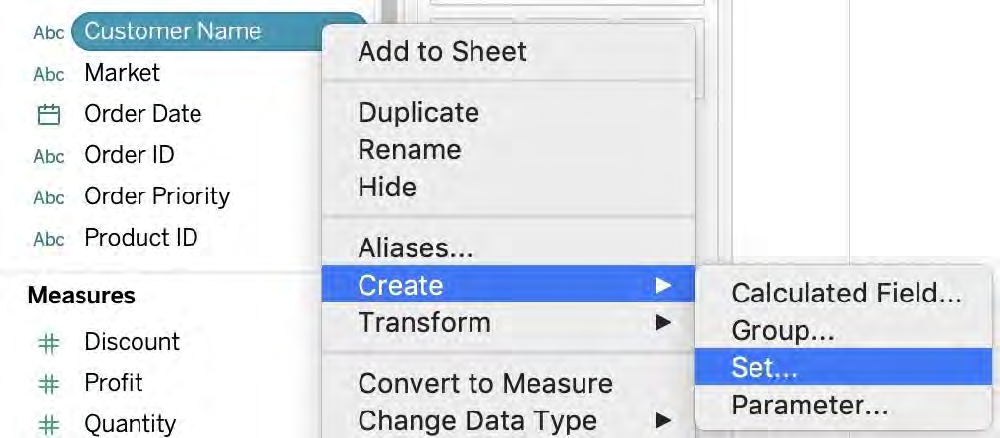
customers whose Sales > 30,000 1) Right click on customer name--> Create--> Set
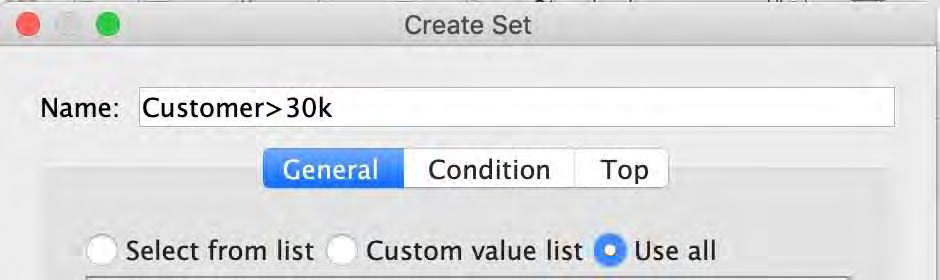
2) Let's Name the Set-Customer>30k ( you can name it anything you want :) ) Select USE ALL, and then move to the CONDITION TAB:
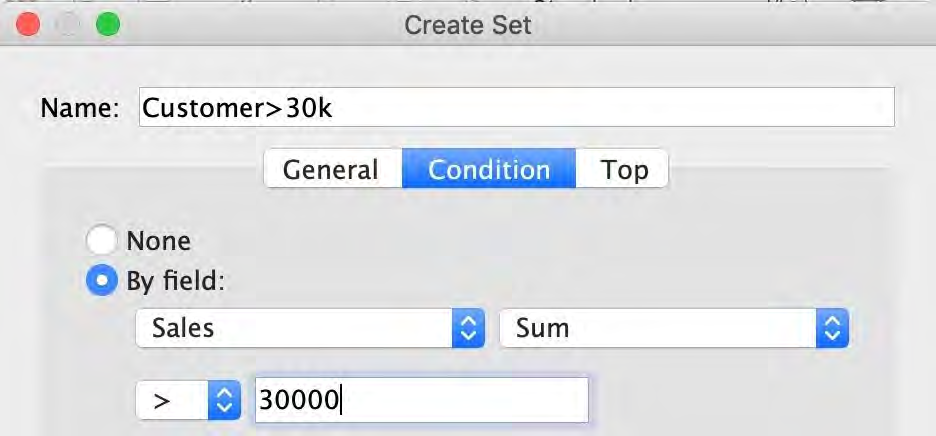
3) In the Condition Tab, Choose BY FIELD-> Select Sales-> Sum-> Greater than 30000 , and click OK
4) You should now have a new Set in the Data Pane as follows:
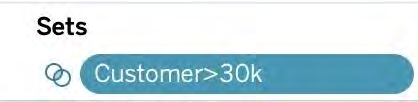
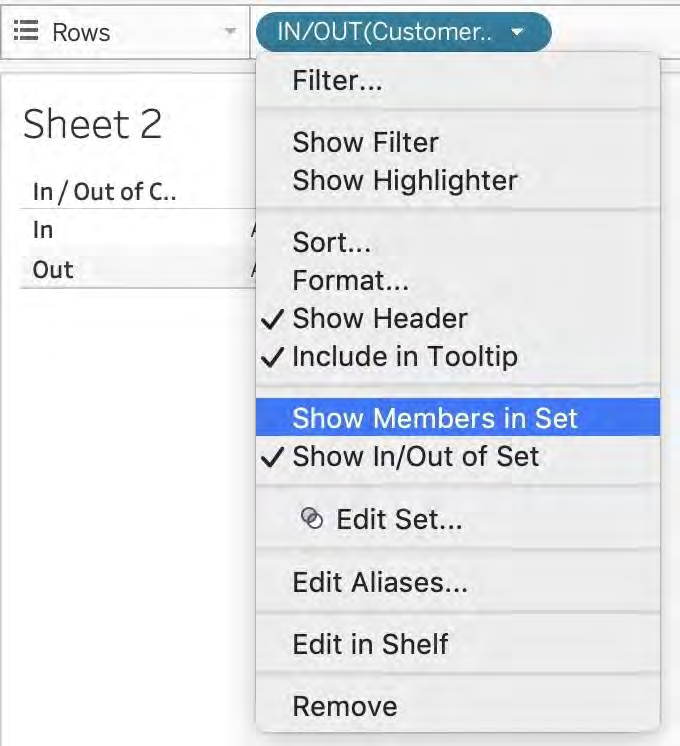
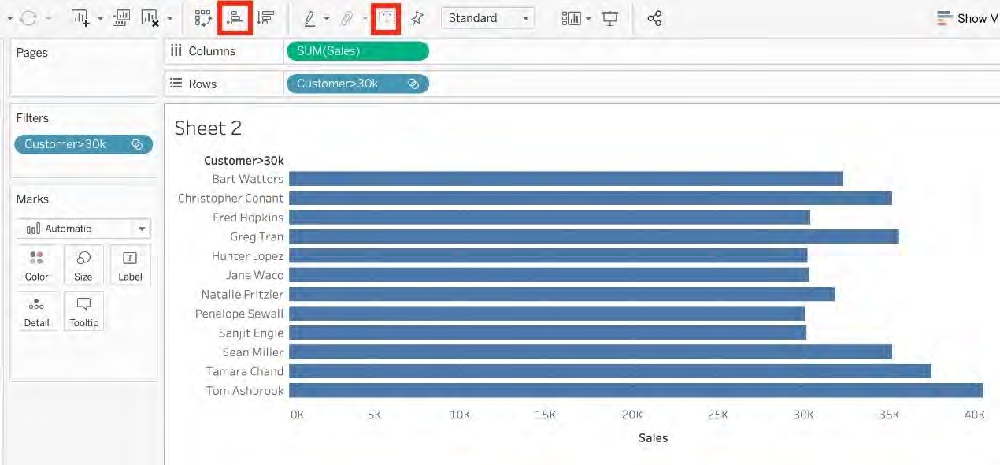
5) Drag this set to the rows shelf, and click on SHOW MEMBERS IN SET. Now drag Sales to the Column
Shelf.
6) Click on the Show Mark Labels, and Sort ascending icons as shown:
7) Voila! We have our answer:
True or False: It is possible to add a field to more than one hierarchy
Correct answer: A
Yes! It is possible to duplicate a field and add it to more than one hierarchy. Right click and choose duplicate.
References:
https://www.tableau.com/about/blog/2016/8/take-note-these-10-handy-tableau-shortcuts-57561
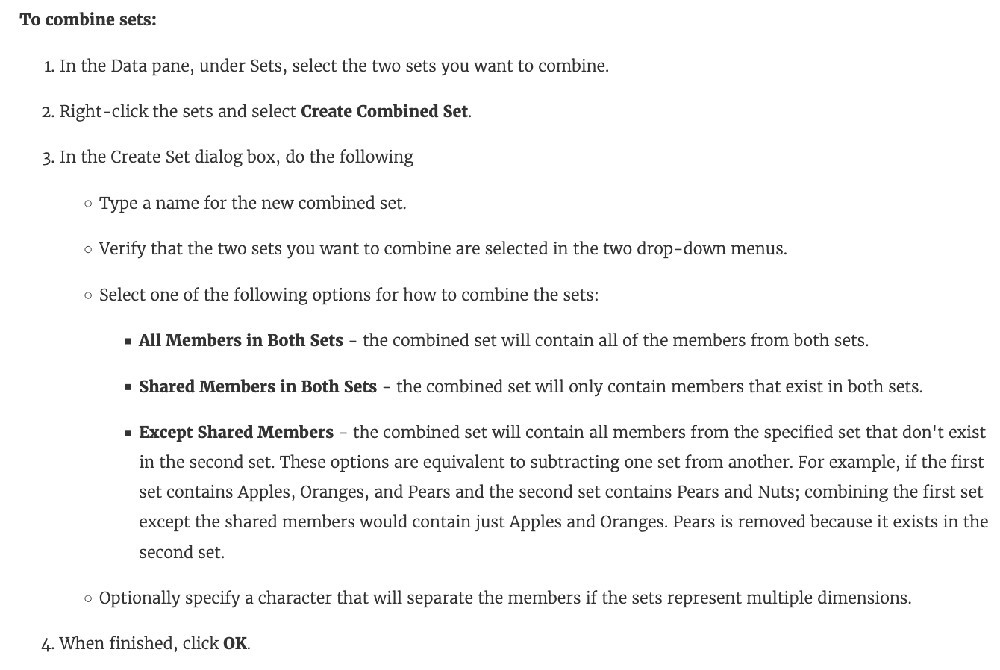
Which of the following sets would you use to compare the members?
Correct answer: D
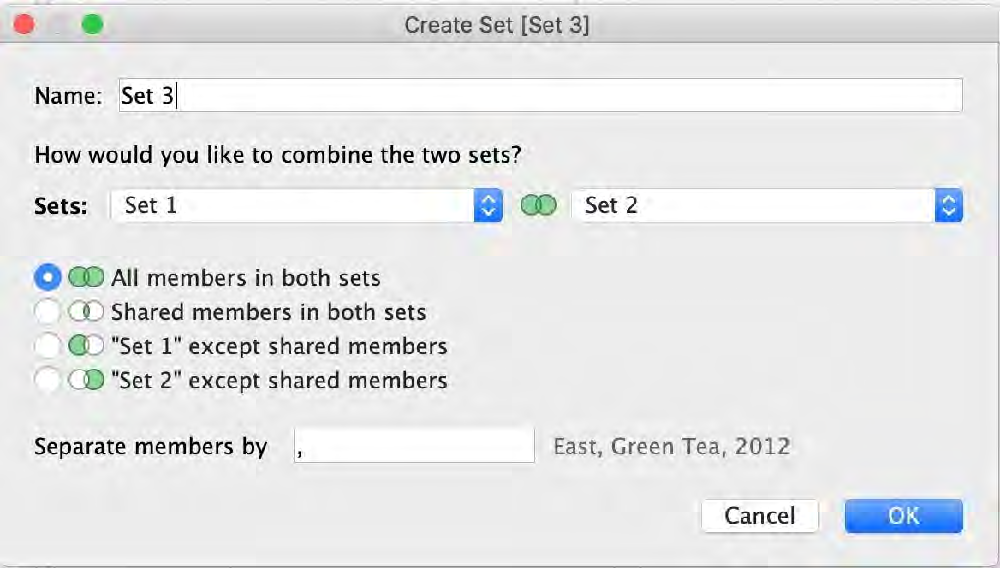
You can combine two sets to compare the members. When you combine sets you create a new set containing either the combination of all members, just the members that exist in both, or members that exist in one set but not the other. Combining sets allows you to answer complex questions and compare cohorts of your data. For example, to determine the percentage of customers who purchased both last year and this year, you can combine two sets containing the customers from each year and return only the customers that exist in both sets. To combine two sets, they must be based on the same dimensions. That is, you can combine a set containing the top customers with another set containing the customers that purchased last year. However, you cannot combine the top customers set with a top products set.
Text, letter
References:
https://help.tableau.com/current/pro/desktop/en-us/sortgroup_sets_create.htm
Using the CoffeeChain table, create a Dual Axis chart showing the Sales (Bar chart) and Profit (Line Chart) for each Product type.
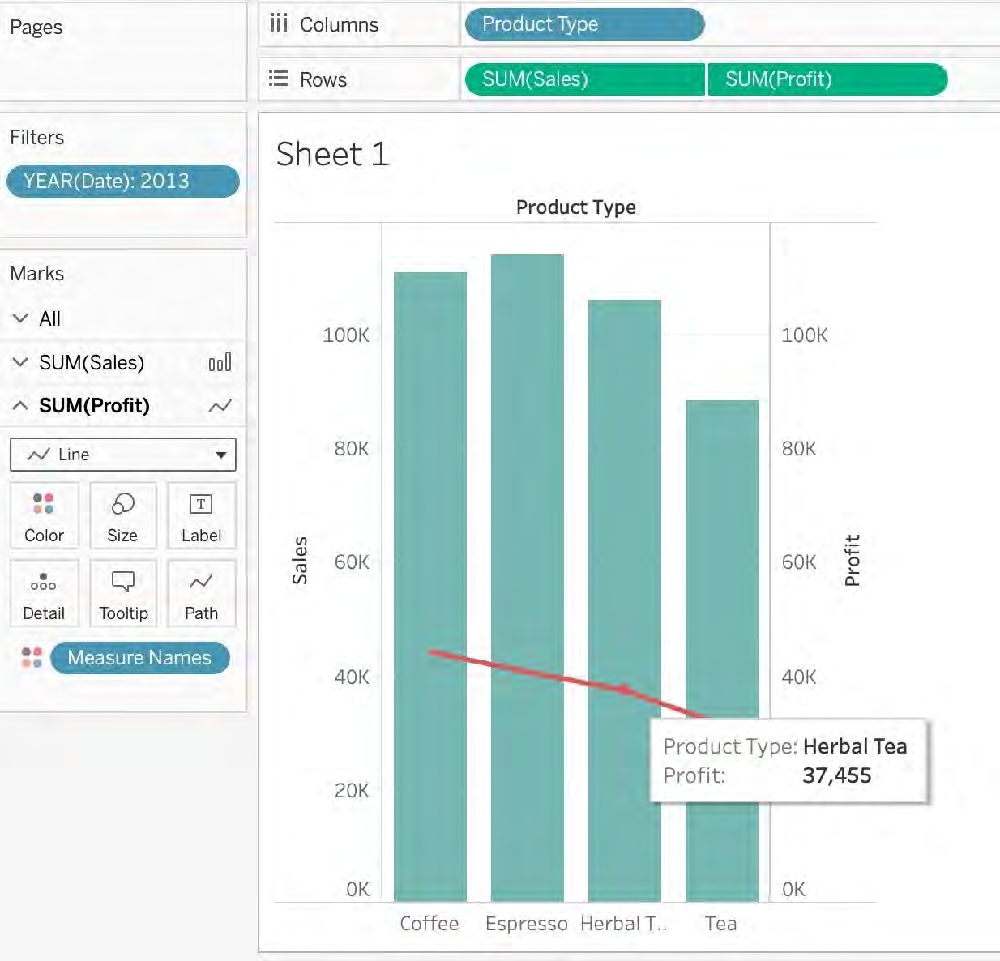
What was the Profit for the Herbal Tea product type in 2013?
Correct answer: C
If you answered this question quickly and correctly, you're well prepared for the exam! Most students stumble while creating a Dual axis chart, so go ahead and give yourself a pat on the back! To create a dual axis chart for the problem mentioned:
1) Drag Product Type to the column shelf, and Sales and Profit to the Row shelf:

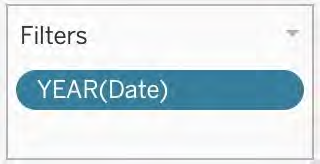
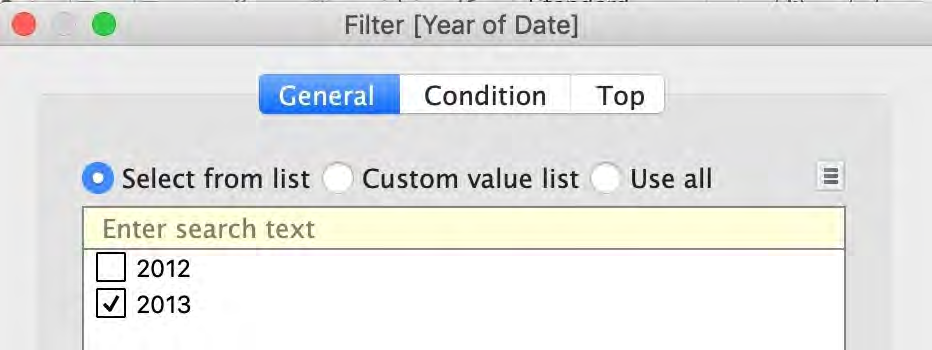
2) Now, to focus on 2013, drag Date to the filter shelf and select only 2013:
3) Now, click on the Profit pill in the Rows Shelf, and select dual axis:
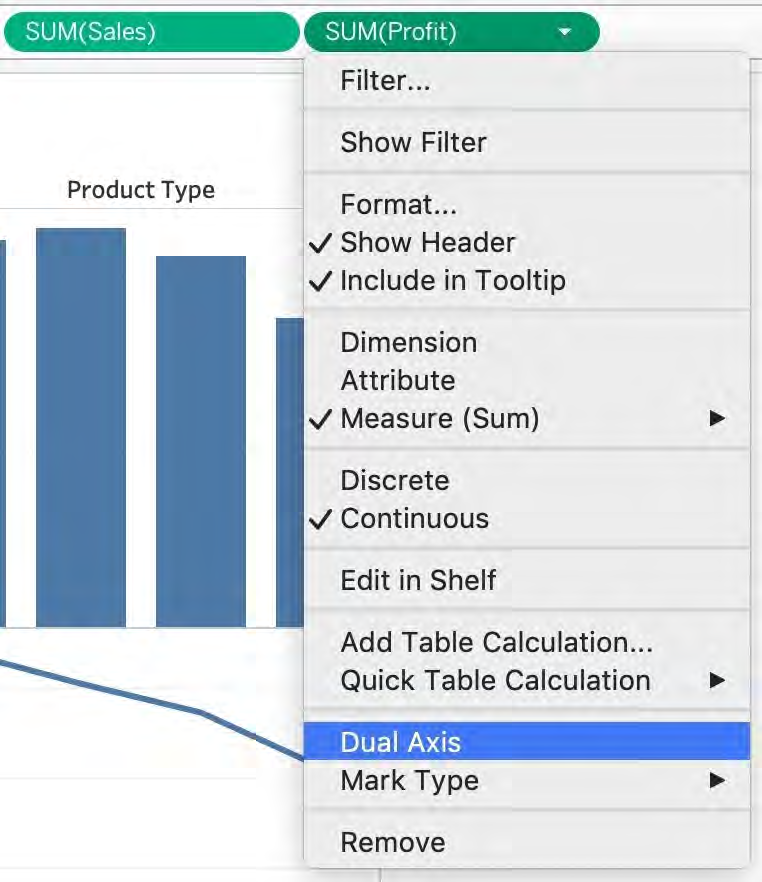
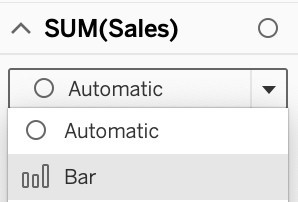
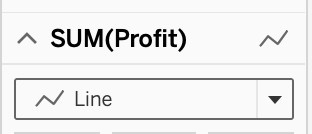
4) Now, in the marks shelf, choose Sales, and change the chart type to bar. Similarly, for Profit, change the chart type to Line.
Now the chart looks like this:
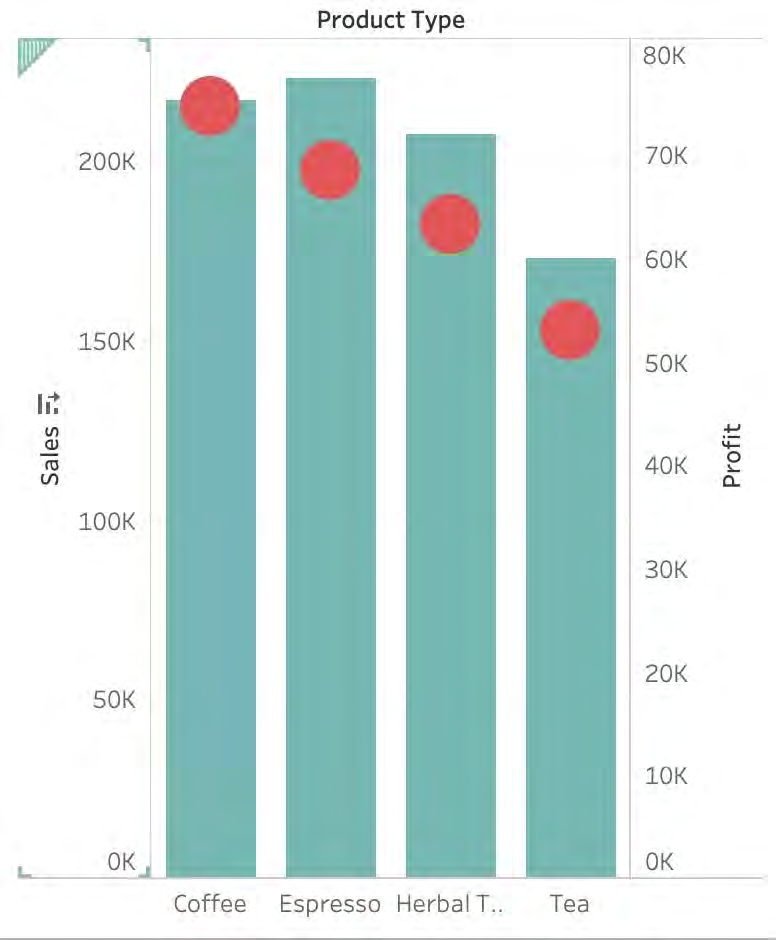
Now we change the Profit chart type to line:
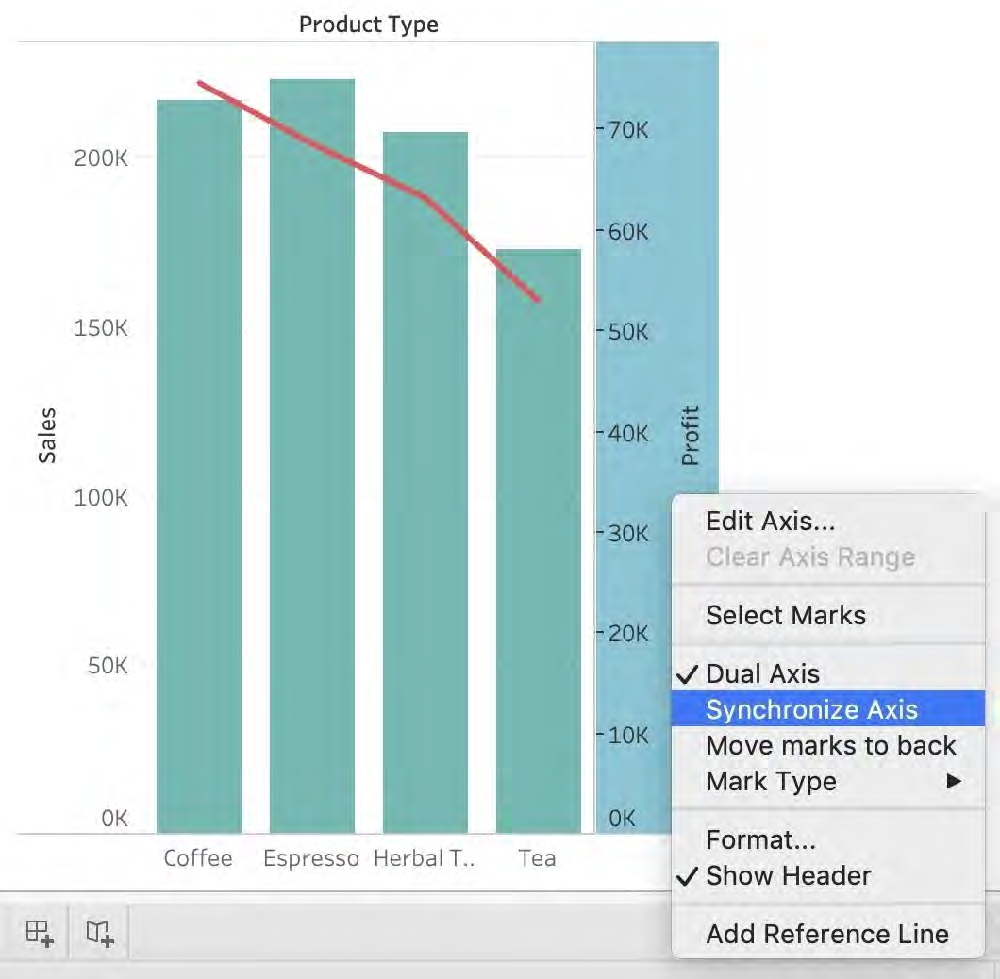
5) Finally, we synchronise the axis as follows: Right click on the axis, and choose 'Synchronise axis'
________________ files are shortcuts for quickly connecting to the original data that you use often. Data source files do not contain the actual data but rather the information necessary to connect to the actual data as well as any modifications you've made on top of the actual data such as changing default properties, creating calculated fields, adding groups, and so on.
Correct answer: B
According to the official Tableau documentation:
Tableau data source files have the .tds file extension. Data source files are shortcuts for quickly connecting to the original data that you use often. Data source files do not contain the actual data but rather the information necessary to connect to the actual data as well as any modifications you've made on top of the actual data such as changing default properties, creating calculated fields, adding groups, and so on. For more information, see Save Data Sources.
References:
https://help.tableau.com/current/pro/desktop/en-us/environ_filesandfolders.htm
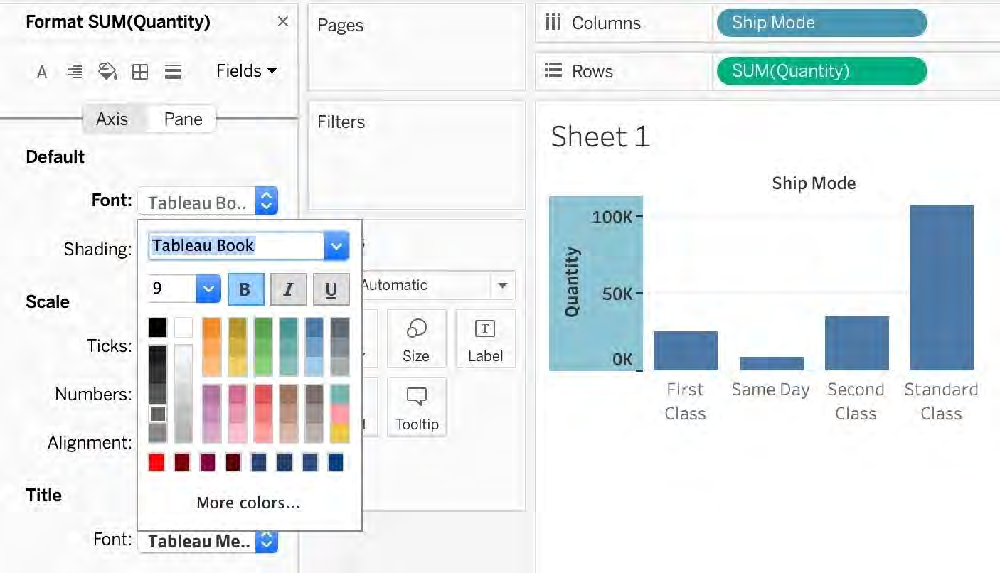
Which of the following are valid way(s) to make either of Rows or Columns Bold without affecting the other?
Correct answers: A, D
1) Right click on Rows or Columns, and choose format. In the Font option click on Bold. (CORRECT)-this will modify only the selected axis (row or column)
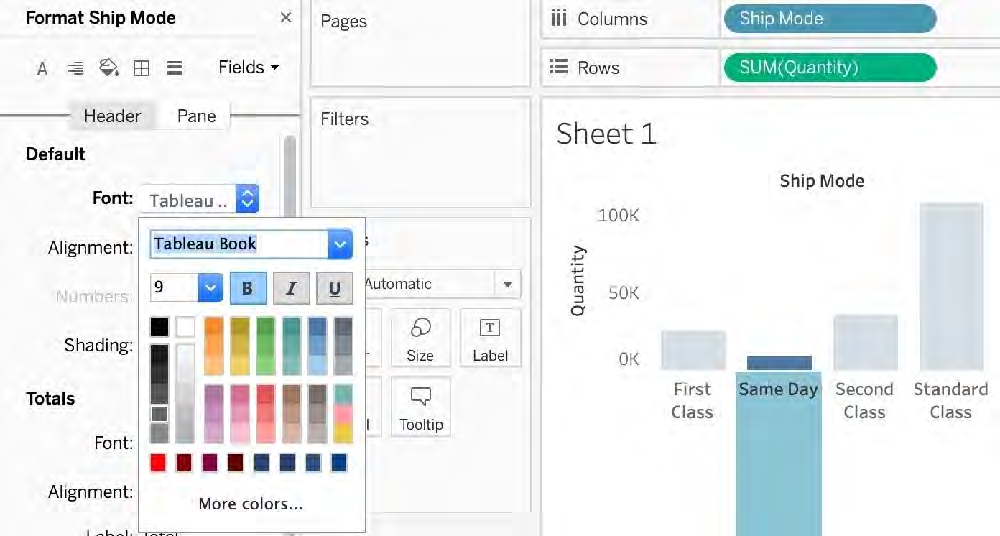
2) Choose Format then Font from the Menu bar, and select Bold under the Header option (INCORRECT)- this modifies both rows and columns at the same time
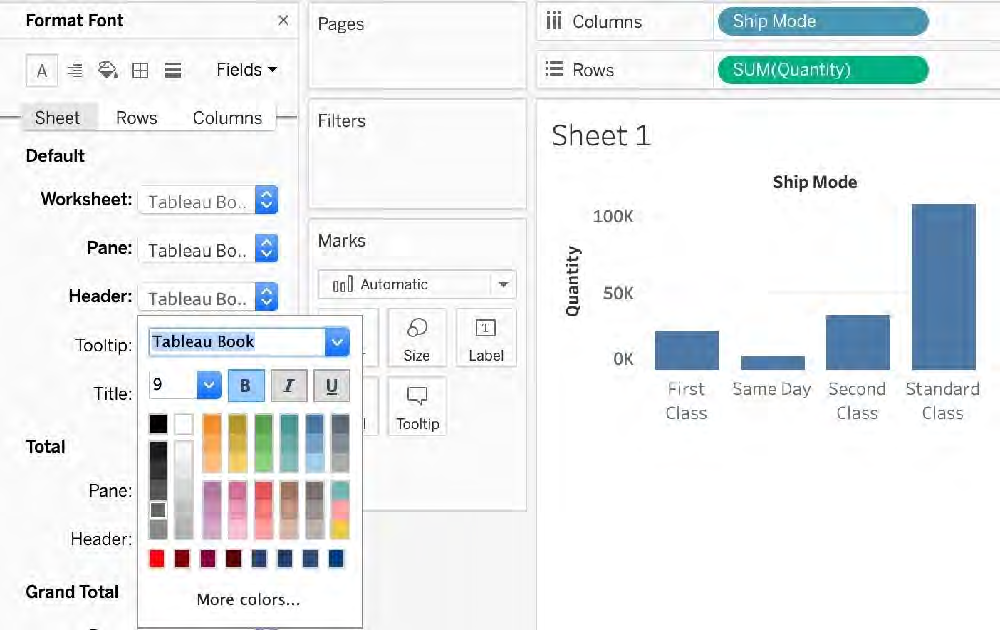
3) Choose Format from the Menu bar, select Row or Column, and then select Bold under the header option (CORRECT)-this will modify only the selected axis (row or column)
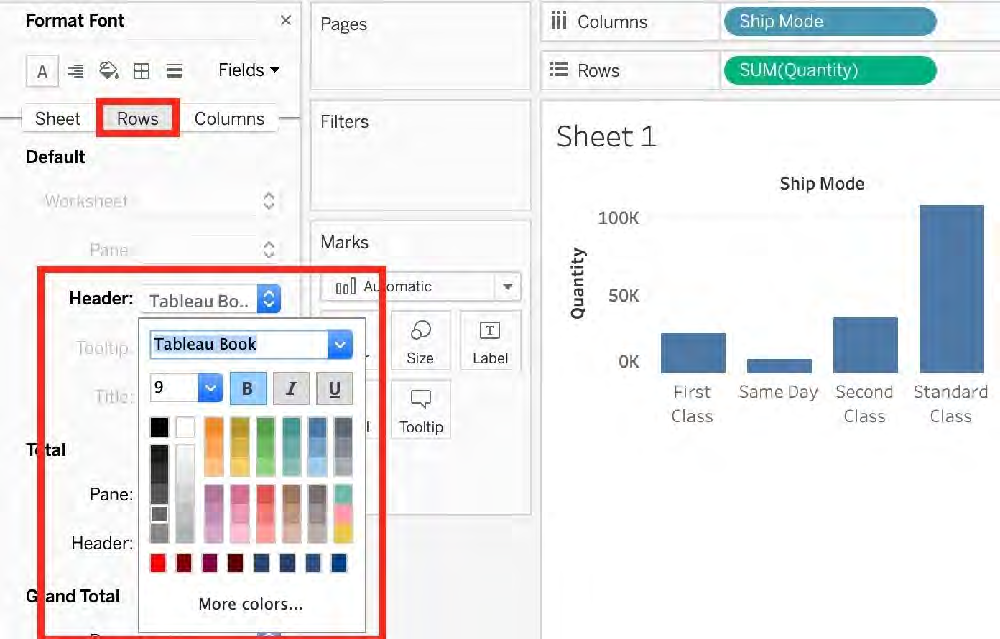
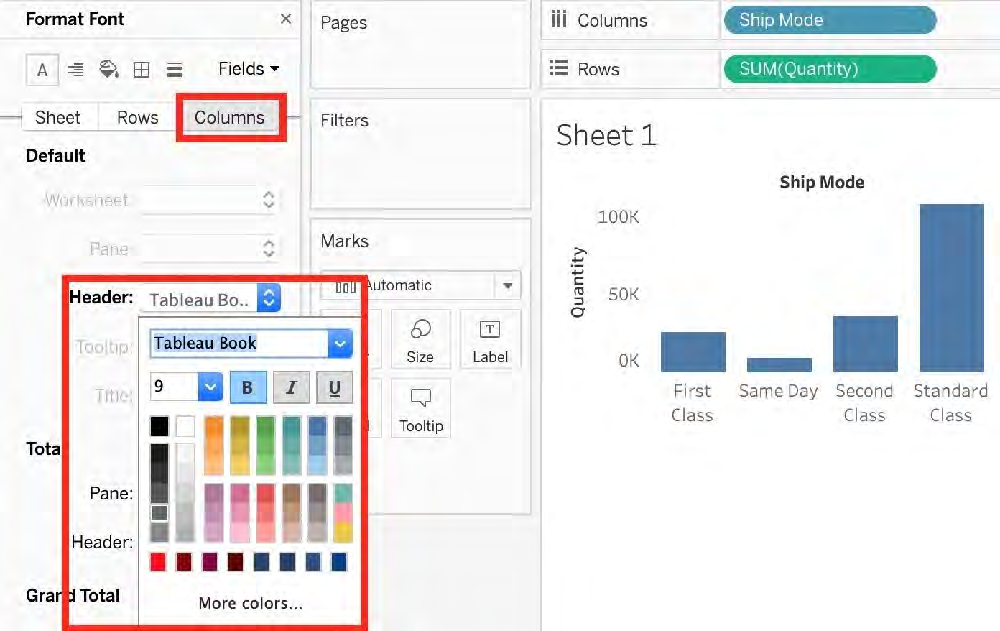
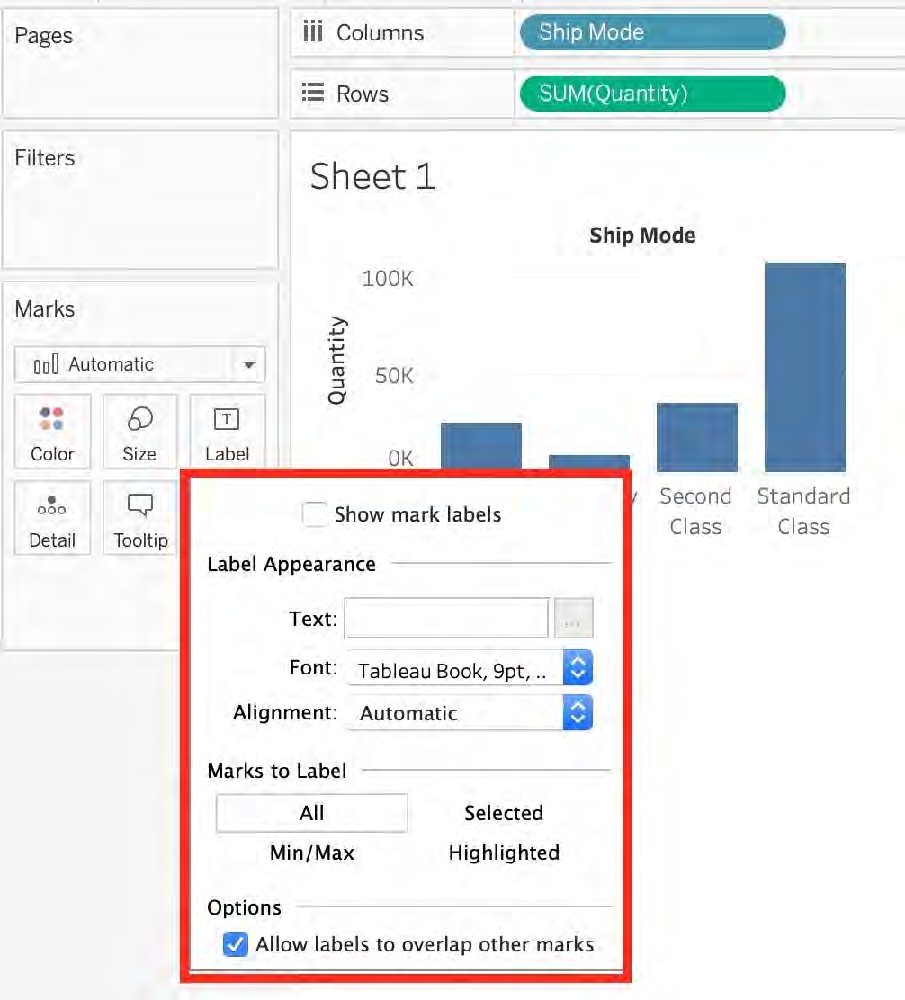
4) Select Text Label on the Marks Card, choose Rows or Columns, and then select Bold. (INCORRECT)-
no such option exists
You have the following visualization.
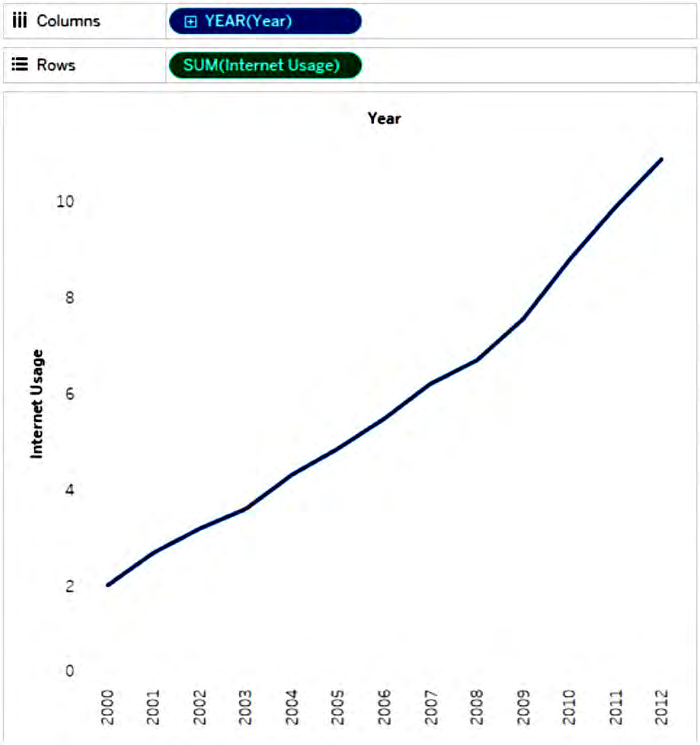
You need to show how Internet Usage values change from year-to-year as a percentage.
Which quick table calculation should you apply to the Internet Usage field?
Correct answer: D
calculate growth/decline with percentage difference