TDS-C01 Exam Details
-
Exam Code
:TDS-C01 -
Exam Name
:Tableau Certified Desktop Specialist -
Certification
:Tableau Certifications -
Vendor
:Tableau -
Total Questions
:341 Q&As -
Last Updated
:Jul 11, 2026
Tableau TDS-C01 Online Questions & Answers
-
Question 71:
Which aggregation is available without requiring a table calculation or calculated field?
A. Percent of total
B. Running total
C. Sample covariance
D. Standard deviation -
Question 72:
You have the following string value: Sales Data.
Which calculated field produces an output of Sales?
A. LEFT (“Sales Data”)
B. LEFT (“Sales Data”, 5)
C. LTRIM (“Sales Data”)
D. RTRIM (“Sales Data”) -
Question 73:
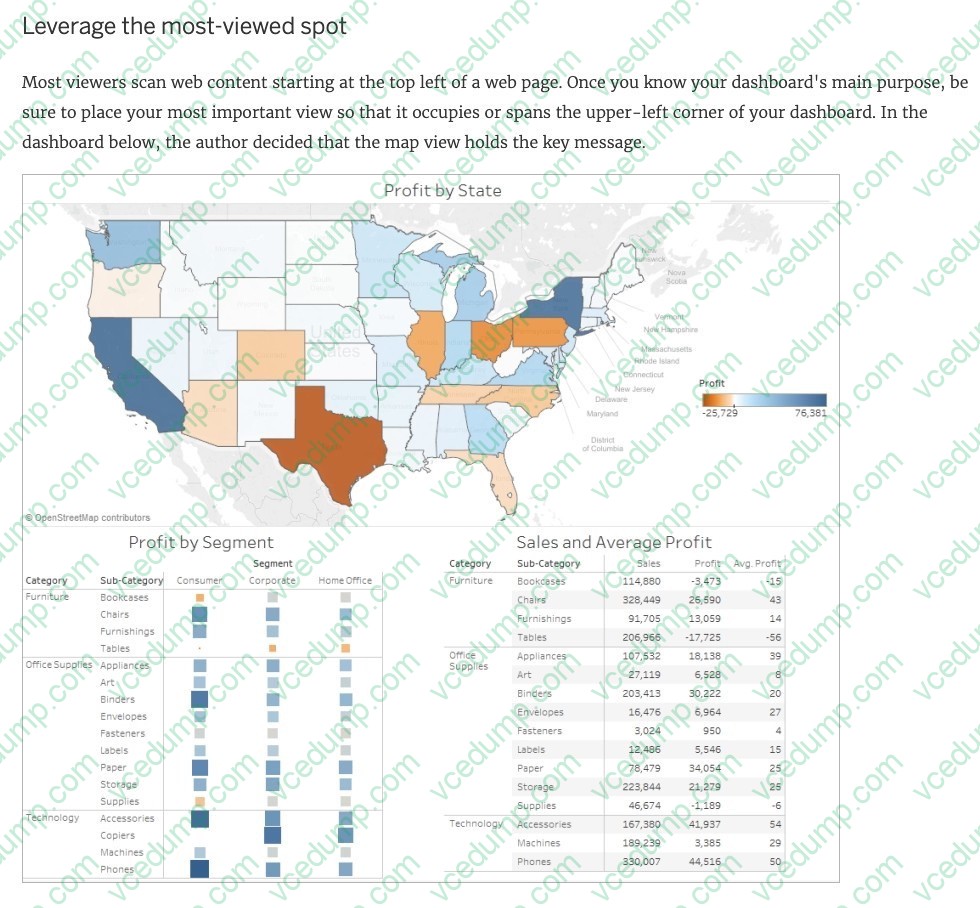
Most viewers scan content starting at the _____________ of a page.
A. top left
B. center
C. bottom left
D. bottom right
E. top right -
Question 74:
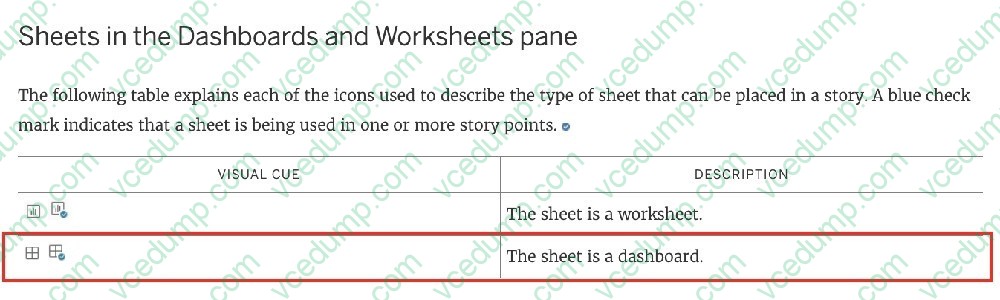
What does the following icon do in Tableau? Larger image
A. Create a Story
B. Create a Story and Dashboard both
C. Create a Worksheet
D. Create a Dashboard -
Question 75:
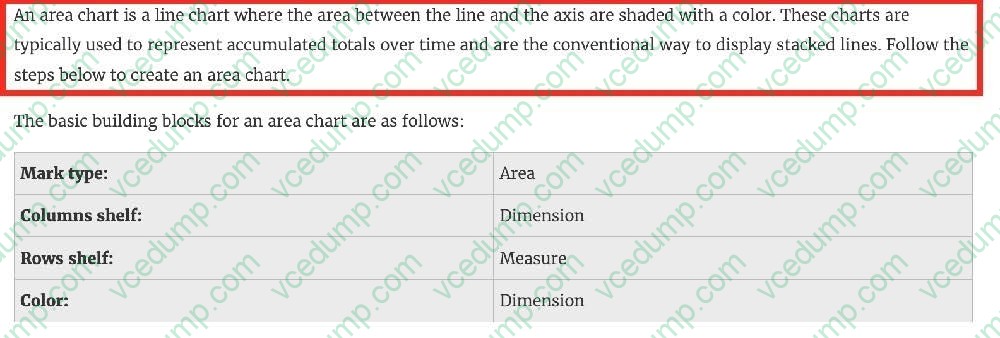
_____________ charts are typically used to represent accumulated totals over time and are the conventional way to display stacked lines.
A. Line
B. Area
C. Gantt
D. Bullet -
Question 76:
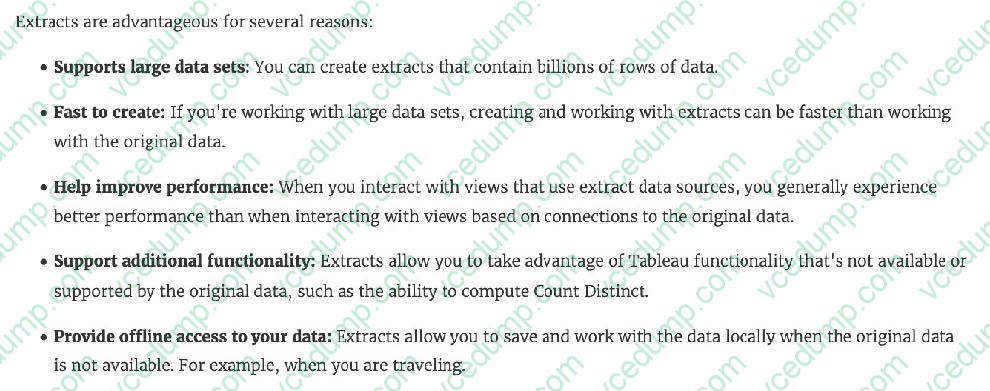
Which of the following are valid reasons to use a Tableau Data Extract (.tde) over Live Connections?
A. To support additional functionality such as count distinct
B. Fast to create
C. Help improve performance
D. To have access to the freshest possible data at all times -
Question 77:
Which two statements accurately describes measures? (Choose two.)
A. They affect the level of detail in the view
B. They contain qualitative values
C. They can be continuous or discrete
D. They contain numeric, quantitative values -
Question 78:
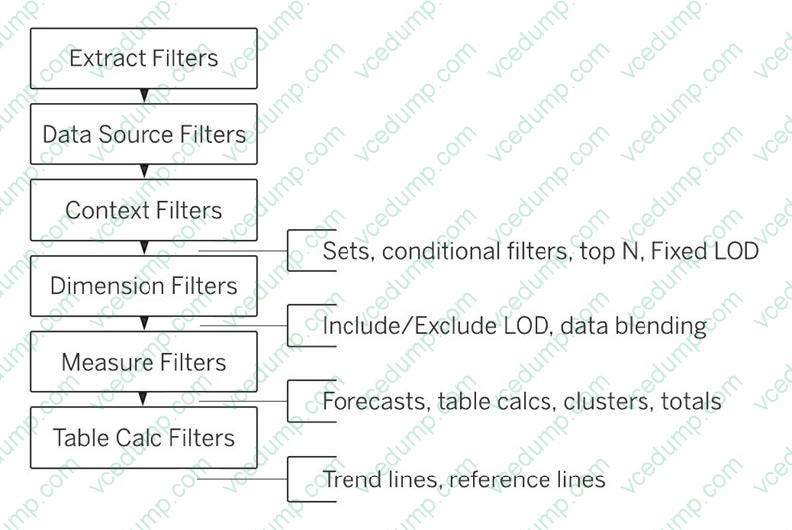
According to Tableau's 'Order of Operations', which of the following filters is applied FIRST?
A. Dimension Filter
B. Measure Filter
C. Context Filter
D. Extract Filter -
Question 79:
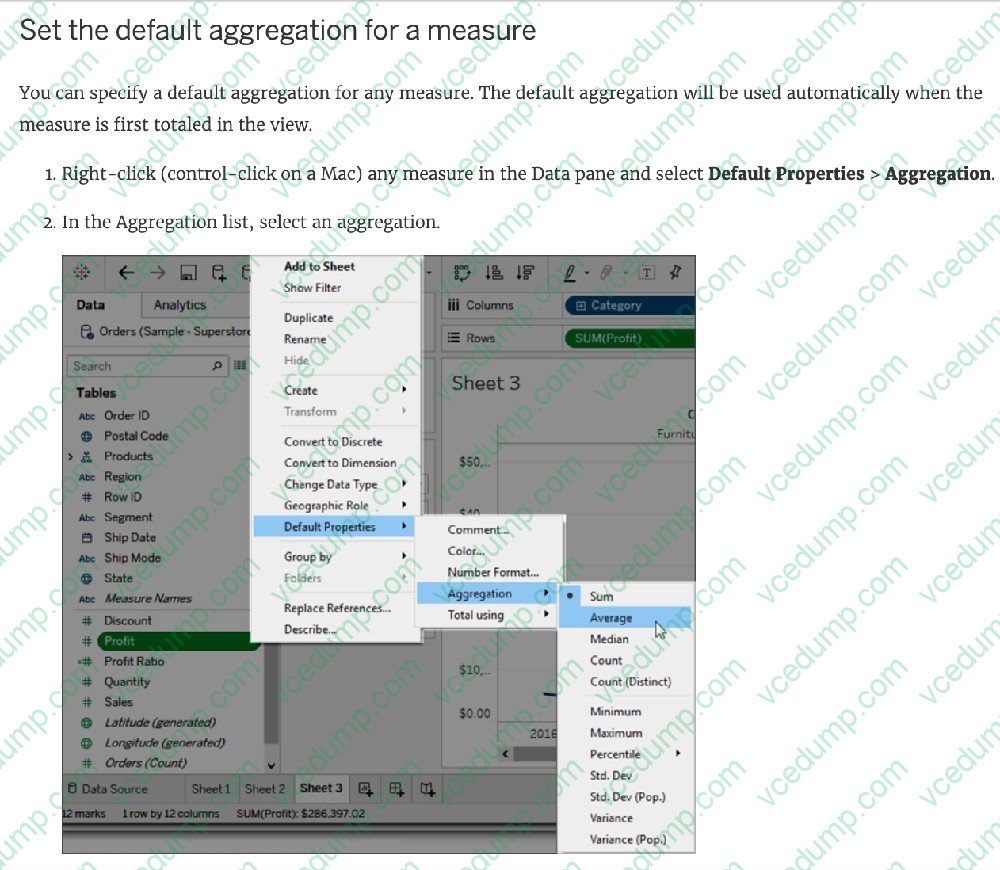
How can you change the Default Aggregation for a measure in Tableau?
A. By changing its properties manually every time we need to use it
B. By right clicking the dimension-> Default properties and choosing Aggregation
C. By right clicking the measure-> Default properties and choosing Aggregation
D. By double clicking on the measure, and then choosing Window-> Default Aggregation -
Question 80:
Which action describes the process for changing a measure so that it automatically aggregates an average instead of a sum?
A. Right-click the field in the Data pane and select Change Data Type to change it.
B. Add the field to the view, right-click the axis, and select Format to change it.
C. Right-click and drag the field into the view to change it.
D. Right-click the field in the Data pane and select Default Properties to change it.
Tips on How to Prepare for the Exams
Nowadays, the certification exams become more and more important and required by more and more enterprises when applying for a job. But how to prepare for the exam effectively? How to prepare for the exam in a short time with less efforts? How to get a ideal result and how to find the most reliable resources? Here on Vcedump.com, you will find all the answers. Vcedump.com provide not only Tableau exam questions, answers and explanations but also complete assistance on your exam preparation and certification application. If you are confused on your TDS-C01 exam preparations and Tableau certification application, do not hesitate to visit our Vcedump.com to find your solutions here.