You need each record to alternate between grey and white.
What should you change in the Format Shading pane?
A. the row banding size to 1
B. the column banding size to 1
C. the row banding size to 3
D. the column banding size to 3
Correct Answer: A
Explanation: To have each record alternate between grey and white, you should change the row banding size to 1 in the Format Shading pane. This setting will ensure that each row has a different shading from the one above and below it, creating an alternating pattern of grey and white rows. References: The answer can be verified through practical application within Tableau or by consulting Tableau's official learning resources, such as Tableau Help: Format Shading or Tableau Training Pass: Formatting.
Question 52:
You have a Tableau workbook.
You want to make the workbook available in Tableau Online.
What should you do?
A. From the Server menu, select Tableau Public, and then select Save to Tableau Public.
B. From the File menu, select Export Packaged Workbook.
C. From the Server menu, select Publish Data Source.
D. From the Server menu, select Publish Workbook.
Correct Answer: D
Explanation: To make a workbook available in Tableau Online, you need to publish it from Tableau Desktop to Tableau Online. You can do this by selecting Publish Workbook from the Server menu, signing in to your Tableau Online account,
choosing a project and a name for your workbook, and clicking Publish. This will upload your workbook and its data sources to Tableau Online, where you can view, edit, and share it with others. References:
Tableau Certified Data Analyst Exam Prep Guide, page 10, section "Publishing and Scheduling Data Refreshes"
Tableau Help: Publish a Workbook
Question 53:
You have a data source that has two tables named Table1 and Table2. Table1 is the primary table and Table2 is the secondary table.
You want to combine the tables by using Tableau Prep. The combined table must include only values from Table1 that do NOT match any values in Table2. The field values from Table2 must appear as null values.
Which type of join should you use?
A. Left only
B. Union
C. Inner
D. Left
E. Full outer
Correct Answer: A
To combine the tables by using Tableau Prep and include only values from Table1 that do not match any values in Table2, you should use a left only join. A left only join is a type of join that returns only the rows from the primary table (Table1) that have no matching rows in the secondary table (Table2). The field values from Table2 will appear as null values in the combined table. A left only join is also known as an anti-join or an exclusion join. References: Tableau Certified Data Analyst Exam Prep Guide, page 9, section "Preparing Data" Tableau Help: Join Your Data Tableau Help: Left Only Join
Question 54:
You have a data source that contains 20 tables.
You want the tables to be organized within the Data pane based on the type of data contained within the tables.
What should you use?
A. Folders
B. Hierarchies
C. Sets
D. Groups
Correct Answer: A
Explanation: To organize the tables in the Data pane based on the type of data contained within the tables, you should use folders. Folders are a way to manually group fields, parameters, sets, or tables in the Data pane according to your preference. You can create folders by right-clicking on the fields or tables you want to group and selecting Folders > Create Folder. You can also drag and drop fields or tables into existing folders. You can name the folders according to the type of data they contain, such as sales, customer, product, etc. Folders can help you find and access the fields or tables you need more easily and efficiently. References: Organize and Customize Fields in the Data Pane - Tableau Tableau Certified Data Analyst Study Guide
Question 55:
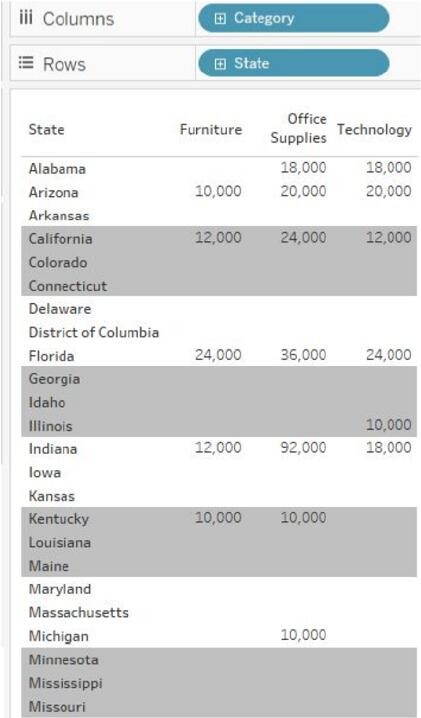
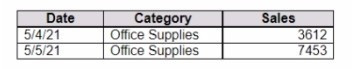
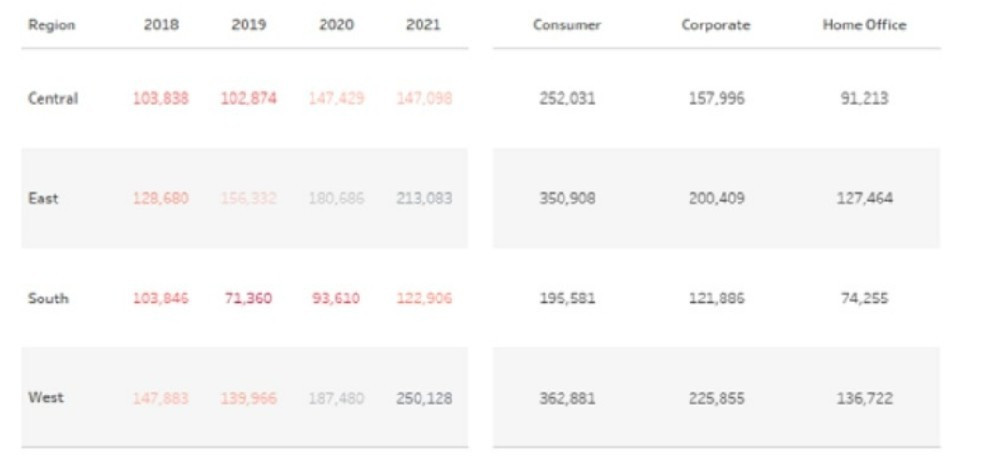
You have the following dataset
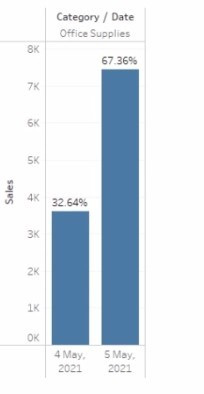
You need to create the following visualization.
Which quick table calculation should you drag to Text on the Marks card?
A. Percent of Total
B. Percent Difference
C. Compound Growth Rate
D. Percentile
Correct Answer: A
Explanation: we need to create a quick table calculation that shows the percent of total sales for each category and sub-category. To do this, we can follow these steps:
Drag Category to Columns and Sub-Category to Rows.
Drag Sales to Text on the Marks card.
Right-click Sales on the Marks card and select Quick Table Calculation > Percent of Total.
Right-click Sales on the Marks card again and select Compute Using > Category. This will create a quick table calculation that shows the percent of total sales for each sub- category within each category. The visualization will look like this:
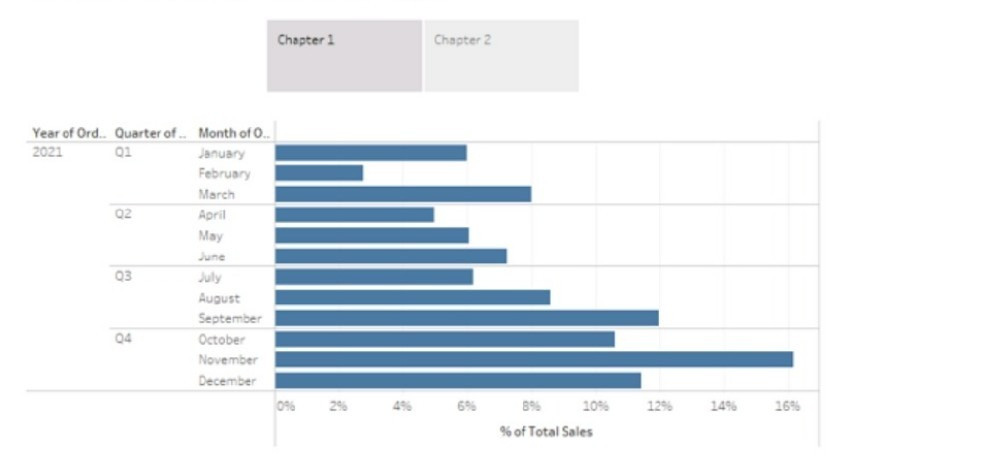
Question 56:
You create the following story that contains two story point.
You want to change the story point format to show the current story point number out of the total number of story points.
Which Layout option should you use?
A. Dots
B. Arrows only
C. Caption boxes
D. Numbers
Correct Answer: D
Explanation: To change the story point format to show the current story point number out of the total number of story points, you should use the Numbers option in the Layout tab. This option will display the story points as numbers in a horizontal or vertical sequence, such as 1/2, 2/2. You can also choose to show or hide the next and previous arrows for navigation. The Numbers option will help you indicate the progress and order of your story points more clearly than the other options. References: Creating a Story - Tableau New in 9.0: Formatting the Story Points Navigator - Tableau Tableau Certified Data Analyst Study Guide
Question 57:
You have the following dashboard that contains two sheets.
You want to minimize the whitespace between the sheets.
What should you configure?
A. The background
B. The position
C. The padding
D. The size
E. The border
Correct Answer: C
Explanation: To minimize the whitespace between the sheets, you should configure the padding of the sheets and the dashboard. Padding is the amount of space between the edge of a sheet or dashboard and its content. You can adjust the padding by using the Layout tab in the Format pane. You can reduce the padding for each sheet by selecting the sheet and changing the values for the inner and outer padding. You can also reduce the padding for the dashboard by selecting the dashboard and changing the values for the outer padding. Reducing the padding will make the sheets and the dashboard more compact and eliminate unnecessary whitespace. References: Format Dashboards - Tableau Tableau Certified Data Analyst Study Guide
Question 58:
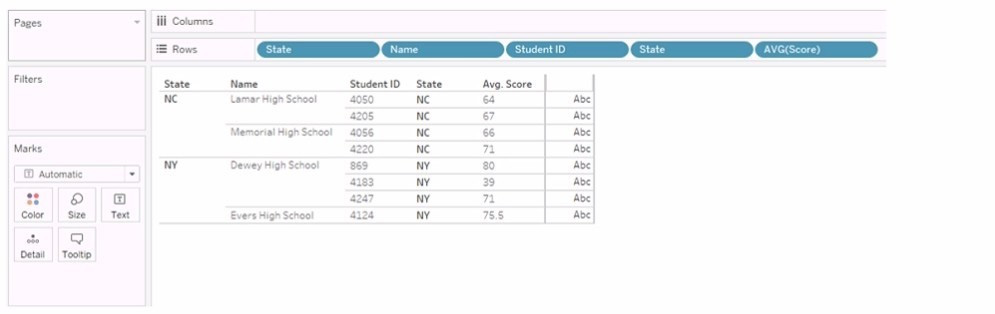
You have the following visualization.
You Create a table calculation named Rank_Score that has a formula of RANK(AVG([Score]), and you drag Rank_Score to Text on the Marks cards.
What is the Rank Score value for Student ID 4220?
A. 5
B. 4
C. 6
D. 3
Correct Answer: C
Explanation: To determine the Rank Score value for Student ID 4220, we look at the visualization provided and apply the table calculation of RANK(AVG([Score])). This function will rank the average scores in ascending order by default, with
the lowest score receiving the rank of 1.
Based on the provided visualization, the scores for the students are as follows (from lowest to highest average score):
Student ID 4183: 39 (Rank 1)
Student ID 4220: 71 (Rank 6)
Student ID 4247: 71 (Rank 6, same score as ID 4220 so they share the same rank)
Student ID 4124: 75.5
Student ID 4050: 64
Student ID 4205: 67
Student ID 4056: 66
Since Student ID 4220 has an average score of 71, which is the third-highest score, it shares the rank with Student ID 4247. However, since Tableau ranks without gaps, the actual rank assigned is 6, considering that there are two students
with a rank of 4 (due to the same average score being the second lowest), making the next rank number 6. Note: The actual ranks for the highest scores are not provided, but they are not needed to determine the rank for Student ID 4220.
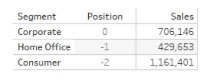
Which function should you use to create the Position column?
A. RANK
B. FIRST
C. INDKX
D. LAST
Correct Answer: B
To create the Position column, you should use the FIRST () function. The FIRST () function returns the number of rows from the current row to the first row in the partition. For example, the first row in a partition will return 0, the second row will return -1, and so on. In this question, the partition is defined by the Segment field, and the table is sorted by the Sales field in descending order. Therefore, the Position column shows the offset of each row from the first row in each segment, based on the sales ranking. References: Tableau Certified Data Analyst Exam Prep Guide, page 11, section "Creating Calculated Fields" Tableau Help: FIRST Function
Question 60:
You are subscribed to several views. You need to unsubscribe from the views.
What should you use?
A. The My Content area of Tableau web pages
B. The Notifications area of Tableau Prep
C. The Data Source page of Tableau Desktop
D. The Shared with Me page
Correct Answer: A
Explanation: To unsubscribe from the views, you should use the My Content area of Tableau web pages. This area allows you to manage your subscriptions, as well as your workbooks, views, and data sources. You can select the views you want to unsubscribe from, click Actions, and then click Unsubscribe. You can also change the subscription options, such as the schedule, the format, or the message. References: Create a Subscription to a View or Workbook - Tableau Tableau Certified Data Analyst Study Guide
Nowadays, the certification exams become more and more important and required by more and more enterprises when applying for a job. But how to prepare for the exam effectively? How to prepare for the exam in a short time with less efforts? How to get a ideal result and how to find the most reliable resources? Here on Vcedump.com, you will find all the answers. Vcedump.com provide not only Tableau exam questions, answers and explanations but also complete assistance on your exam preparation and certification application. If you are confused on your TDA-C01 exam preparations and Tableau certification application, do not hesitate to visit our Vcedump.com to find your solutions here.