PL-300 Exam Details
-
Exam Code
:PL-300 -
Exam Name
:Microsoft Power BI Data Analyst -
Certification
:Microsoft Certifications -
Vendor
:Microsoft -
Total Questions
:546 Q&As -
Last Updated
:Jul 15, 2026
Microsoft PL-300 Online Questions & Answers
-
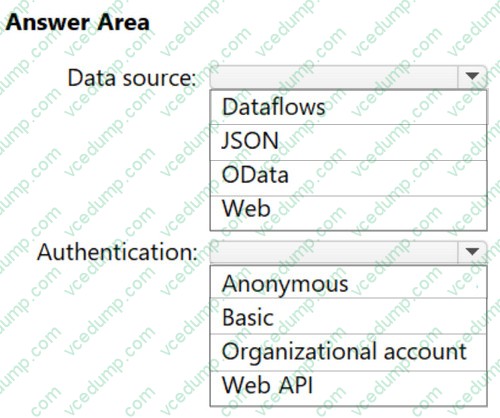
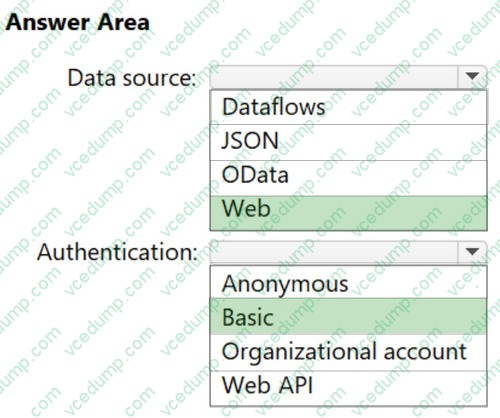
Question 101:
HOTSPOT
You plan to use Power Query Editor to get data from an API.
The API returns a JSON response.
You have a username and password tor the API.
Which data source and authentication method should you use to connect to the API? To answer, select the appropriate options in the answer area.
NOTE: Each correct selection is worth one point.
-
Question 102:
You are building a Power Bl report.
Users will view the report by using their mobile device.
You need to configure the report to display data based on each user s location.
Which two actions should you perform? Each correct answer presents part of the solution.
NOTE: Each correct selection is worth one point.
A. For the relevant columns, set synonyms to match common geographical terms.
B. From Power Query Editor, detect the data types of the relevant columns.
C. Use the columns of the geography data type in all visuals.
D. Create a hierarchy for columns of the geography data type.
E. In Data Category, set the geographic data category for the relevant columns. -
Question 103:
You have the tables shown in the following table.
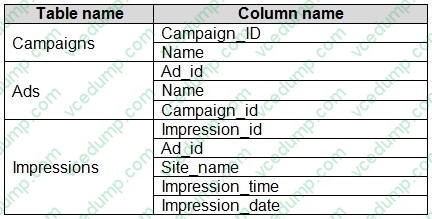
The Impressions table contains approximately 30 million records per month.
You need to create an ad analytics system to meet the following requirements:
1. Present ad impression counts for the day, campaign, and Site_name.
2. The analytics for the last year are required.
3. Minimize the data model size.
Which two actions should you perform? Each correct answer presents part of the solution.
NOTE: Each correct selection is worth one point.
A. Group the impressions by Ad_id, Site_name, and Impression_date.Aggregate by using the CountRows function.
B. Create one-to-many relationships between the tables.
C. Create a calculated measure that aggregates by using the COUNTROWS function.
D. Create a calculated table that contains Ad_id, Site_name, and Impression_date. -
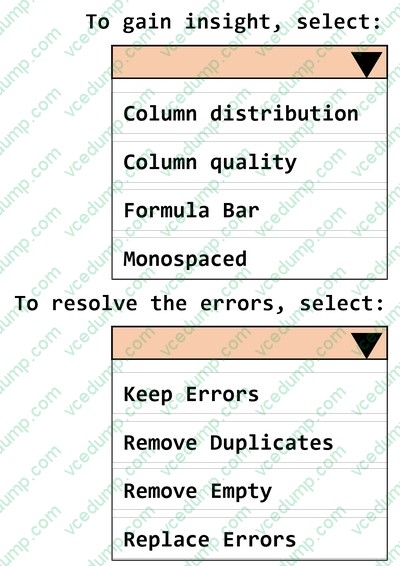
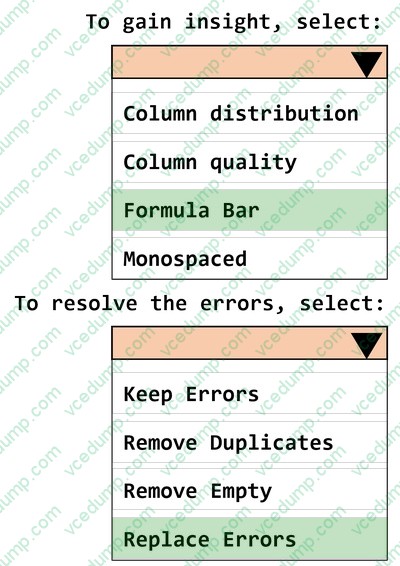
Question 104:
HOTSPOT
You have a Power BI semantic model.
You discover that he semantic model contains values that display as errors.
You need to use data profiling feature in Power Query to preview the date and identify the issues.
What should you select to gain into the number of errors in the model, and what should you select to resolve the errors? To answer, select the appropriate options in the answer area.
NOTE: Each correct answer is worth one point.
-
Question 105:
You have a Power BI semantic model named Model1 that contains two fields named Sales and Quarter. Model1 contains a DAX measure that sums the Sales column.
You need to create a report that will contain the visual shown in the following exhibit.
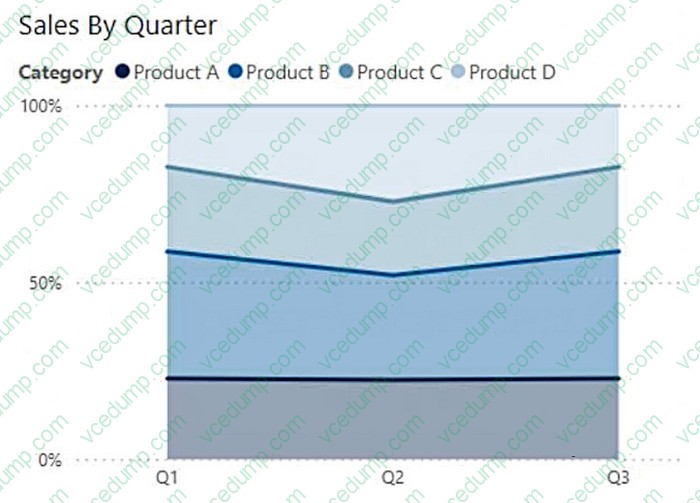
The solution must NOT require additional DAX measures.
Which type of visual should you use?
A. ribbon chart
B. line chart
C. 100% stacked area chart
D. area chart -
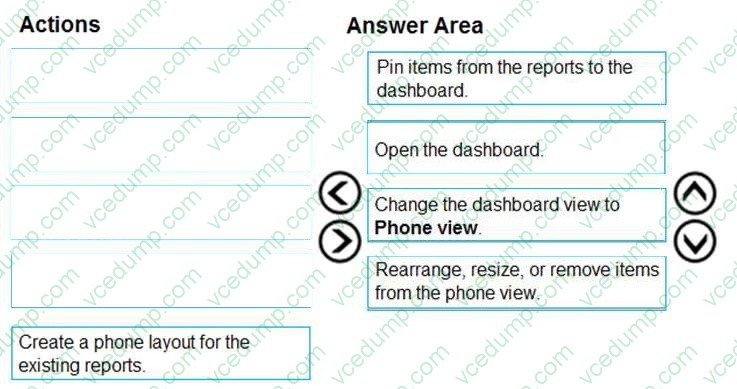
Question 106:
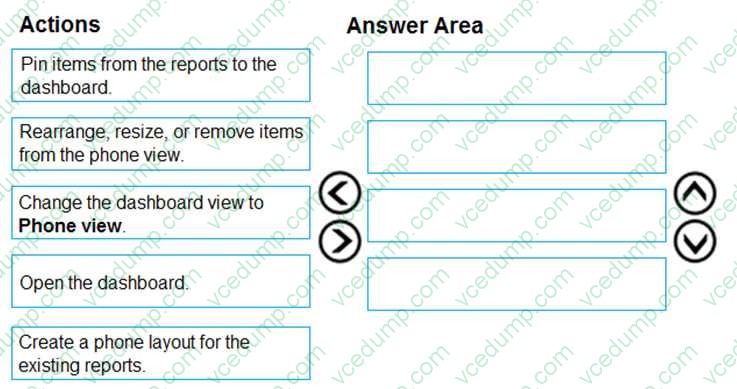
DRAG DROP
You are using existing reports to build a dashboard that will be viewed frequently in portrait mode on mobile phones.
You need to build the dashboard.
Which four actions should you perform in sequence? To answer, move the appropriate actions from the list of actions to the answer area and arrange them in the correct order.
Select and Place:
-
Question 107:
You have a semantic model named Model1 that contains sales data.
You need to ensure that Modell is refreshed on the first day of each month to include last month's sales data.
What should you configure?
A. an on-premises data gateway
B. a Microsoft Rower Automate flow
C. an incremental refresh
D. a scheduled refresh -
Question 108:
You attempt to connect Purer 81 Desktop to a Cassandra database.
From the Get Data connector list you discover that there is no specific connector for the Cassandra database, You need to select an alternate data connector that will connect to the database.
Which of connector should you choose?
A. Microsoft SQL Server database
B. ODBC
C. OData
D. OLE DB -
Question 109:
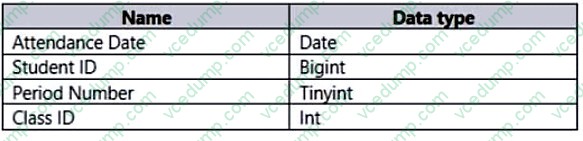
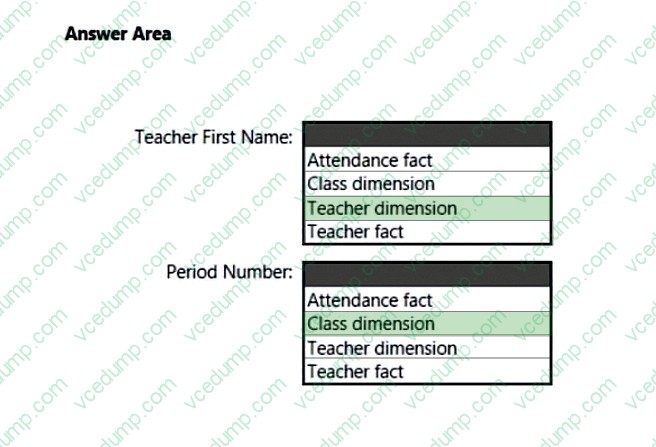
HOTSPOT
You plan to create a Power Bl dataset to analyze attendance at a school. Data will come from two separate views named View1 and View? in an Azure SQL database. View1 contains the columns shown in the following table.
View2 contains the columns shown in the following table.
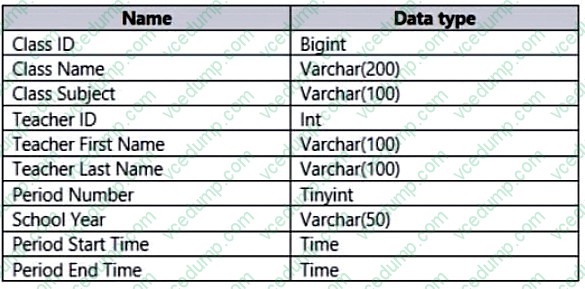
The views can be related based on the Class ID column.
Class ID is the unique identifier for the specified class, period, teacher, and school year. For example, the same class can be taught by the same teacher during two different periods, but the class will have a different class ID.
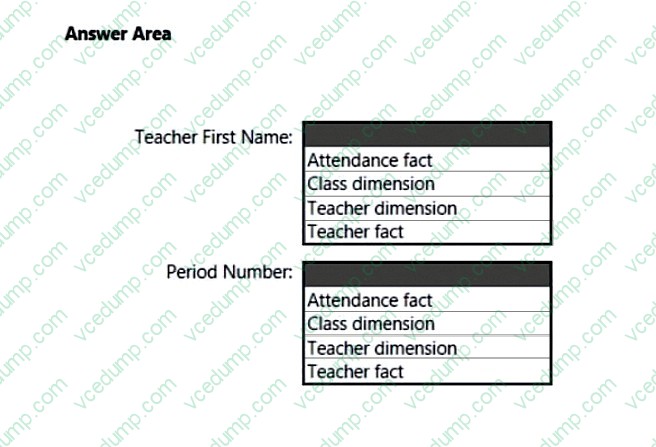
You need to design a star schema data model by using the data in both views. The solution must facilitate the following analysis:
1. The count of classes that occur by period
2. The count of students in attendance by period by day
3. The average number of students attending a class each month
In which table should you include the Teacher First Name and Period Number fields? To answer, select the appropriate options in the answer area.
NOTE: Each correct selection is worth one point.
-
Question 110:
You build a Power Bi report that displays loT temperature data streaming from a refrigerator.
You publish the report to the Power BI service.
You need to be notified when the temperature rises above four degrees Celsius.
What should you do?
A. Set an alert on a KPI visual in the report.
B. Pin a card visual to a dashboard and create a subscription.
C. Pin a card visual to a dashboard and set an alert on the tile.
D. Pin a report page to a dashboard and set an alert on the page.
Related Exams:
-
62-193
Technology Literacy for Educators -
70-243
Administering and Deploying System Center 2012 Configuration Manager -
70-355
Universal Windows Platform – App Data, Services, and Coding Patterns -
77-420
Excel 2013 -
77-427
Excel 2013 Expert Part One -
77-725
Word 2016 Core Document Creation, Collaboration and Communication -
77-726
Word 2016 Expert Creating Documents for Effective Communication -
77-727
Excel 2016 Core Data Analysis, Manipulation, and Presentation -
77-728
Excel 2016 Expert: Interpreting Data for Insights -
77-731
Outlook 2016 Core Communication, Collaboration and Email Skills
Tips on How to Prepare for the Exams
Nowadays, the certification exams become more and more important and required by more and more enterprises when applying for a job. But how to prepare for the exam effectively? How to prepare for the exam in a short time with less efforts? How to get a ideal result and how to find the most reliable resources? Here on Vcedump.com, you will find all the answers. Vcedump.com provide not only Microsoft exam questions, answers and explanations but also complete assistance on your exam preparation and certification application. If you are confused on your PL-300 exam preparations and Microsoft certification application, do not hesitate to visit our Vcedump.com to find your solutions here.