70-779 Exam Details
-
Exam Code
:70-779 -
Exam Name
:Analyzing and Visualizing Data with Microsoft Excel -
Certification
:Microsoft Certifications -
Vendor
:Microsoft -
Total Questions
:115 Q&As -
Last Updated
:Jan 31, 2022
Microsoft 70-779 Online Questions & Answers
-
Question 71:
You have a workbook query that gets a table from an Excel workbook. The table contains a column1.
In the query, you configure Column1 to use a Data Type of Whole Number.
You refresh the data and find several errors in Column1. You discover that new entries in the table contain nonnumeric characters.
You need to ensure that when the data is imported, any fields that contain nonnumeric values are set 1.
What should you do from Query Editor?
A. Select the table and click Keep Errors.
B. Select the column and click Replace Values...
C. Select the column and click Remove Errors.
D. Select the column and click Replace Errors... -
Question 72:
You have a workbook query that loads data from C:\Data\Users.xlsx.
You move Users.xlsx to a shared folder on the network.
You need to ensure that you can refresh the data from Users.xlsx.
What should you do?
A. From the Linked Table tab in Power Pivot, modify the Update Mode.
B. From Query Editor, modify the Source step.
C. From the Insert tab in Excel, click My Add-ins, and then manage the add-ins.
D. From the Data tab in Excel click Connections, and then modify the properties of the connection. -
Question 73:
You have two Microsoft SQL Server database servers named Production1 and Test1. Production1 contains the same tables as Test1. but only a subset of the data;
You add Test1 as a data source, and you select 10 tables. You configure several transformations.
You need to connect the model to the tables in Production1. The solution must maintain the existing transformations.
Solution: You delete the existing queries, and then you add new data sources.
Does this meet the goal?
A. Yes
B. No -
Question 74:
HOTSPOT
Note: This question is part of a series of questions that use the same scenario. For your convenience, the scenario is repeated in each question. Each question presents a different goal and answer choices, but the text of the scenario is the same in each question in this series.
Start of repeated scenario.
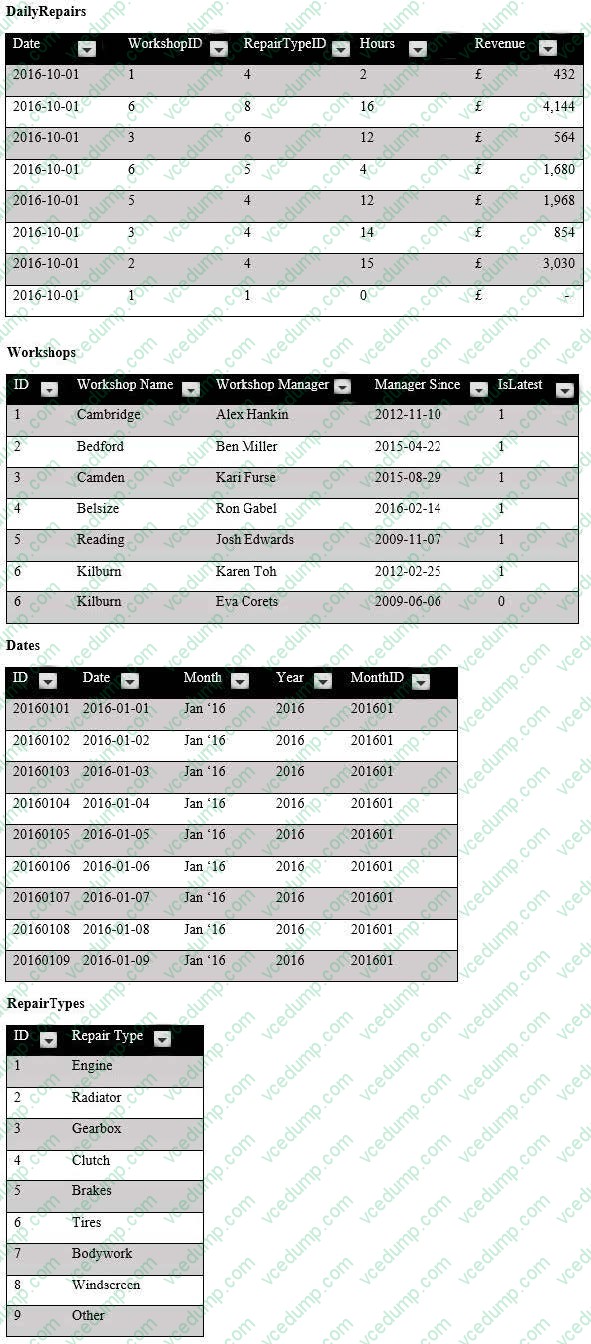
You are creating reports for a car repair company. You have four datasets in Excel spreadsheets. Four workbook queries load the datasets to a data model. A sample of the data is shown in the Data Sample exhibit. (Click the Exhibit button.)
Data Sample exhibit:
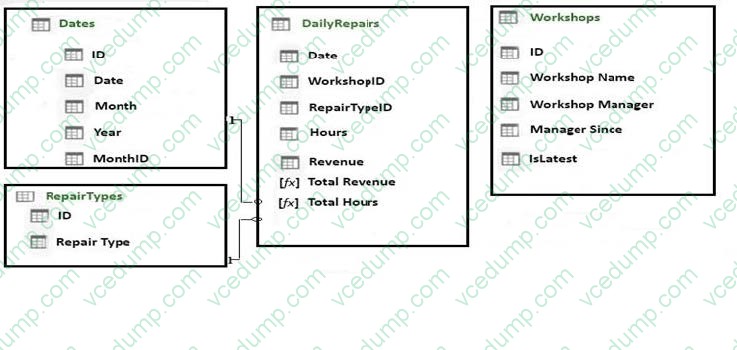
The data model is shown in the Data Model exhibit. (Click the Exhibit button.)
The tables in the model contain the following data:
1. DailyRepairs has a log of hours and revenue for each day, workshop, and repair type. Every day, a log entry is created for each workshop, even if no hours or revenue are recorded for that day. Total Hours and Total Revenue column.
2. Workshops have a list of all the workshops and the current and previous workshop managers. The format of the Workshop Manager column is always Firstname Lastname. A value of 1 in the IsLatest column indicates that the workshop manager listed in the record is the current workshop manager.
3. RepairTypes has a list of all the repair types
4. Dates has a list of dates from 2015 to 2018
End of repeated scenario.
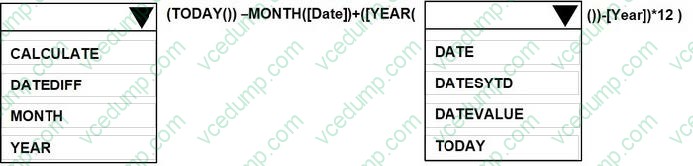
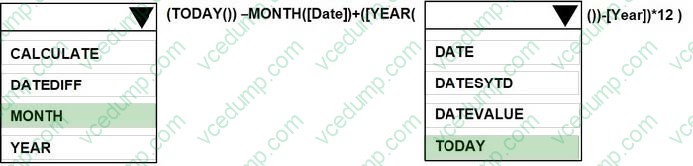
To the Dates table, you need to add a calculated column named Months Ago. Months Ago must display the number of calendar months before the current month. For example, if the current date is July 10, 2017, the Value of Months Ago will be 0 for all the dates in July 2017, 1 for all the dates in June 2017, and 2 for all the dates in May 2017.
How should you complete the DAX formula? To answer, select the appropriate options in the answer area.
NOTE: Each correct selection is worth one point.
Hot Area:
-
Question 75:
Note: This question is part of a series of questions that use the same scenario, For your convenience is repeated in each question. Each question presents a different goal and answer choices, but the text of the scenario is the same in each
question in this series.
Start of repeated scenario
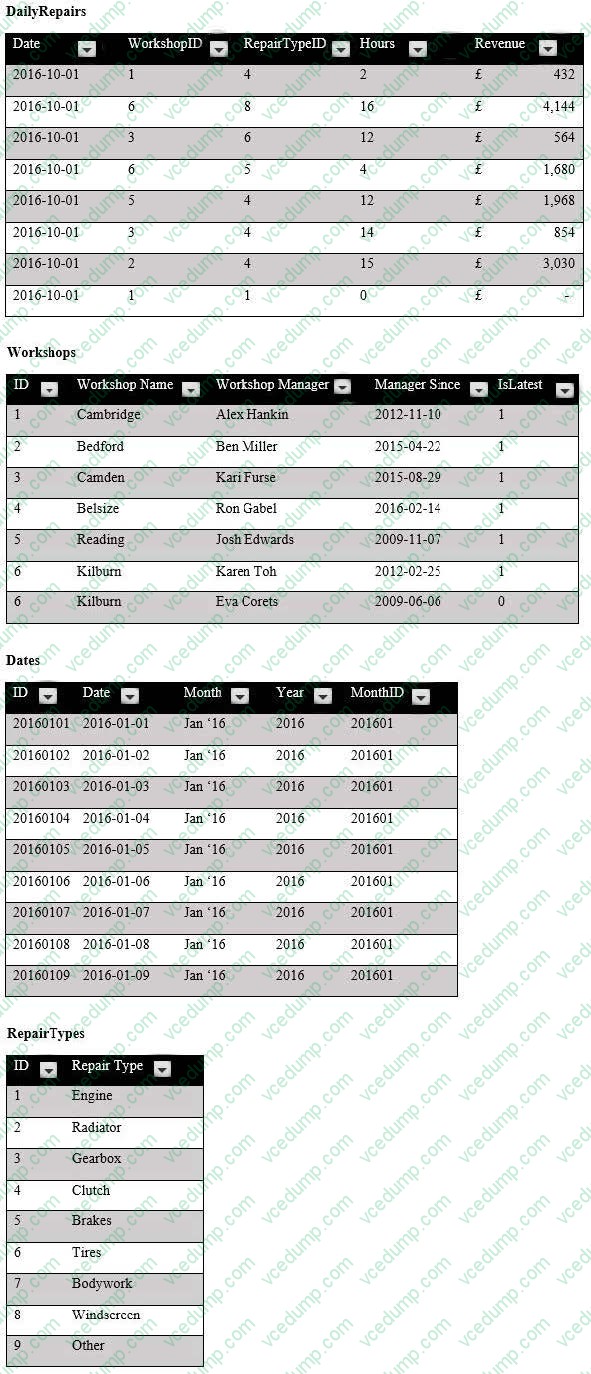
You are creating reports for a car repair company. You have four datasets in Excel spreadsheets. Four workbook queries load the datasets to a data model. A sample of the data is shown in the Data Sample exhibit.
The data model is shown in the Data Model exhibit.
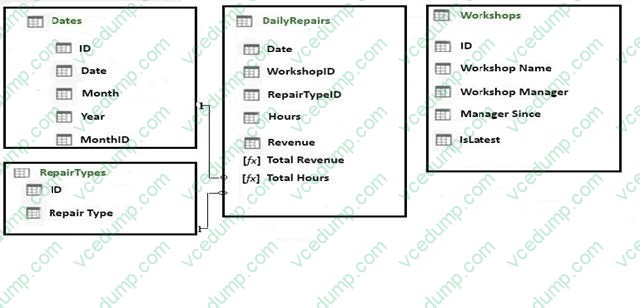
The tables in the model contain the following data:
DailyRepairs has a log of hours and revenue for each day, workshop, and repair type. Every day, a log entry is created for each workshop, even if no hours or revenue are recorded for that day. Total Hours and Total Revenue are two measures defined in DailyRepairs. Total Hours sums the Hours column, and Total Revenue sums the Revenue column.
Workshops has a list of all the workshops and the current and previous workshop managers. The format of the Workshop Manager column is always Firstname Lastname. A value of 1 in the IsLatest column indicates that the workshop
manager listed in the record is the current workshop manager.
RepairTypes has a list of alt the repair types.
Dates has a list of dates from 2015 to 2018.
End of repeated scenario.
You create a measure named Average Revenue Per Hour that calculates the average revenue per hour.
You need to populate a cell in a worksheet to display the Average Revenue Per Hour where Repair Type is Engine.
Which Excel formula should you use?
A. Option A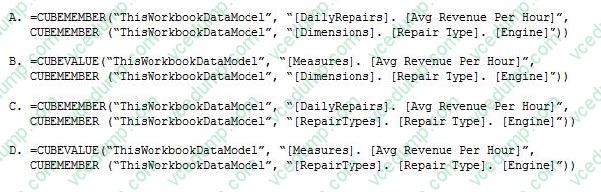
B. Option B
C. Option C
D. Option D -
Question 76:
You have the data model shown in the exhibit. (Click the Exhibit tab.) You need to create a hierarchy from DimproductSubcategory[ProductSubcategoryName] and DimProduct[ProductName].
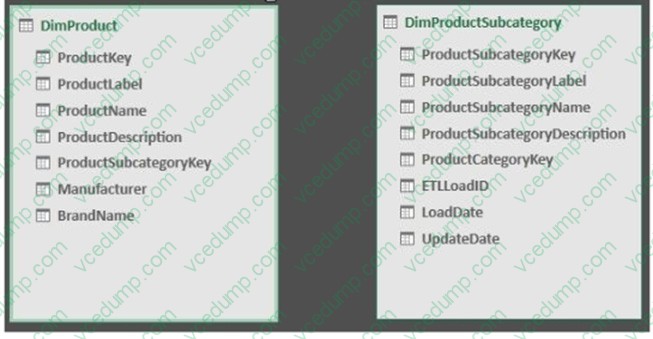
What should you do before you create the hierarchy?
A. Create a relationship between the tables. To DimProductSubcategory, add a calculated column named ProductName that uses the LOOKUPVALUE(DimProduct[ProductName],DimProduct[ProductKey],[ProductKey]) DAX formula.
B. To DimProduct, add a calculated column named ProductSubcategoryName that uses the LOOKUPVALUE(DimProductSubcategory [ProductSubcategoryName],DimProductSubcategory[ProductCategoryKey],[ProductSubcategoryKey]) DAX formula.
C. Create a relationship between the tables. To DimProduct, add a calculated column named ProductSubcategoryName that uses the RELATEDTABLE (DimProductSubcategory[ProductSubcategoryName]) DAX formula.
D. To DimProduct, add a calculated column named ProductSubcategoryName that uses the VALUES(DimProductSubcategory[ProductSubcategoryName]) DAX formula. -
Question 77:
Your network contains a folder that has data files m various formats.
You need to identify how many files of each extension type are in the folder by using Query Editor. What should you do?
A. Create a query that uses a file source, and then use the Count Values command on the Transform tab.
B. Create a query that uses a folder source, and then use the Group By command on the Home tab.
C. Create a query that uses a file source, and then use the Group By command on the Home tab.
D. Create a query that uses a folder source, and then use the Count Values command on the Transform tab. -
Question 78:
Note: This question is part of a series of questions that present the same scenario. Each question in the series contains a unique solution that might meet the stated goals. Some question sets might have more than one
correct solution, while others might not have a correct solution.
After you answer a question in this section, you will NOT be able to return to it. As a result, these questions will not appear in the review screen.
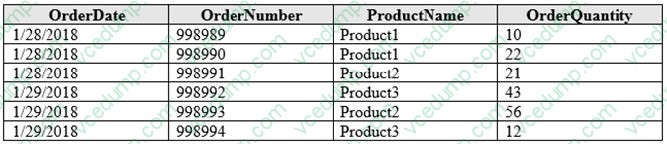
You have the following data.
You need to retrieve a list of the unique ProductName entries.
Solution: Create a PivotTable that uses the ProductName field in the Rows area.
Does this meet the goal?
A. Yes
B. No -
Question 79:
Your company has sales offices in several cities.
You create a table that represents the amount of sales in each city by month as shown in the exhibit.
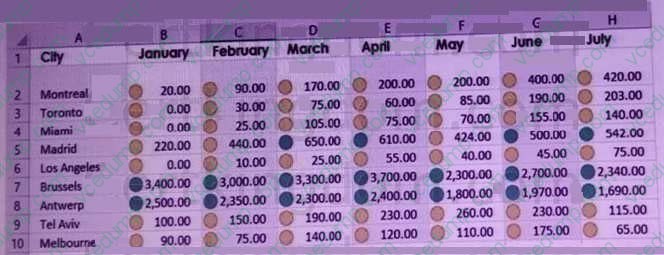
You need to ensure that all values lower than 250 display a red icon. The solution must ensure that all values greater than 500 display a green icon.
Solution: You create a measure, and then define a target value.
Does this meet the goal?
A. Yes
B. No -
Question 80:
You have a workbook query that loads the following table.
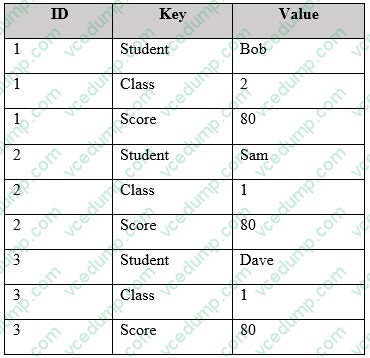
You pivot the table on the key column by using value as the values column, and you receive the results shown in the following table.
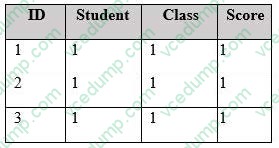
You need to ensure that the data appears as shown in the following table.
A. Change the aggregate value function of the pivot.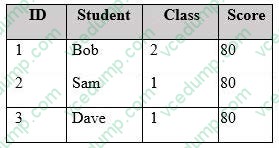
B. Select the ID column, and then click Unpivot Columns
C. Change the Data Type of the Value column.
D. Delete the Picoted Column step. Select the Key column, and the click UnpivotColumns .
Related Exams:
-
62-193
Technology Literacy for Educators -
70-243
Administering and Deploying System Center 2012 Configuration Manager -
70-355
Universal Windows Platform – App Data, Services, and Coding Patterns -
77-420
Excel 2013 -
77-427
Excel 2013 Expert Part One -
77-725
Word 2016 Core Document Creation, Collaboration and Communication -
77-726
Word 2016 Expert Creating Documents for Effective Communication -
77-727
Excel 2016 Core Data Analysis, Manipulation, and Presentation -
77-728
Excel 2016 Expert: Interpreting Data for Insights -
77-731
Outlook 2016 Core Communication, Collaboration and Email Skills
Tips on How to Prepare for the Exams
Nowadays, the certification exams become more and more important and required by more and more enterprises when applying for a job. But how to prepare for the exam effectively? How to prepare for the exam in a short time with less efforts? How to get a ideal result and how to find the most reliable resources? Here on Vcedump.com, you will find all the answers. Vcedump.com provide not only Microsoft exam questions, answers and explanations but also complete assistance on your exam preparation and certification application. If you are confused on your 70-779 exam preparations and Microsoft certification application, do not hesitate to visit our Vcedump.com to find your solutions here.