70-779 Exam Details
-
Exam Code
:70-779 -
Exam Name
:Analyzing and Visualizing Data with Microsoft Excel -
Certification
:Microsoft Certifications -
Vendor
:Microsoft -
Total Questions
:115 Q&As -
Last Updated
:Jan 31, 2022
Microsoft 70-779 Online Questions & Answers
-
Question 101:
You have a PivotChart template named Template1.
You add a PivotChart to a worksheet.
You need to apply the template to the PivotChart.
What should you do?
A. On the Design tab, click Change Chart Type.
B. On the Format tab, click Format Selection.
C. Right-click the chart and then click PivotChart Options.
D. Right-click the chart and then click Format Chart Area. -
Question 102:
You need to create a PivotChart that has a filter as shown in the following exhibit.
A. From the model, create a measure.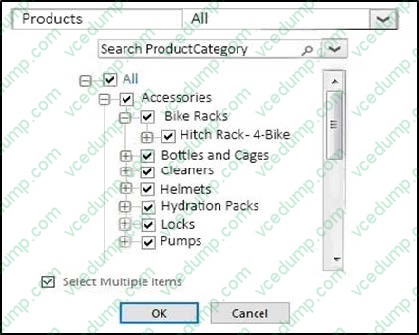
B. From Query Editor, create a function.
C. From Query Editor, create a parameter.
D. From the model, create a hierarchy. -
Question 103:
Note: This question is part of a series of questions that present the same scenario. Each question in the series contains a unique solution that might meet the stated goals. Some question sets might have more than one correct solution, while
others might not have a correct solution.
After you answer a question in this section, you will NOT be able to return to it As a result, these questions will not appear in the review screen.
Your company has sales offices in several cities.
You create a table that the represents the amount of sales in each city by month as shown in the exhibit.
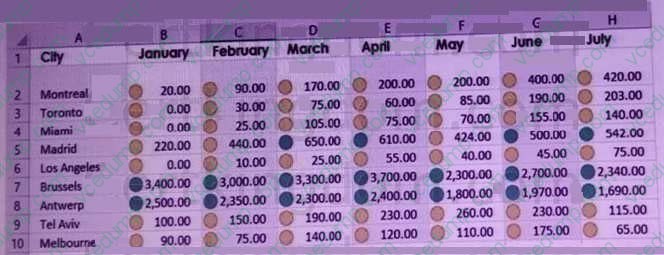
You need to ensure that alt values lower than 250 display a red icon. The solution must ensure that all values greater than 500 display a green icon.
Solution: You create a new conditional formatting rule that uses the Format only cells that contain rule type.
Does this meet the goal?
A. Yes
B. No -
Question 104:
You have the PivotTable shown in the following exhibit.
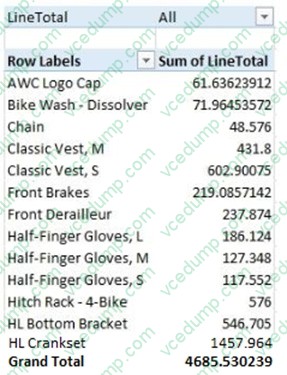
You need to display only rows in the PivotTable in which the sum of LineTotal is greater than 100. What should you do?
A. From Row Label, configure a Label filter.
B. Add a slicer for LineTotal and select the values from the slicer.
C. From Row Label, configure a Value Filter.
D. Add LineTotal to the Filters area of PivotTable Fields. Configure the Filters value. -
Question 105:
Note: This question is part of a series of questions that present the same scenario. Each question in the series contains a unique solution that might meet the stated goals. Some question sets might have more than one correct solution, while
others might not have a correct solution.
After you answer a question in this section, you will NOT be able to return to it. As a result these questions will not appear in the review screen.
You have the following data.
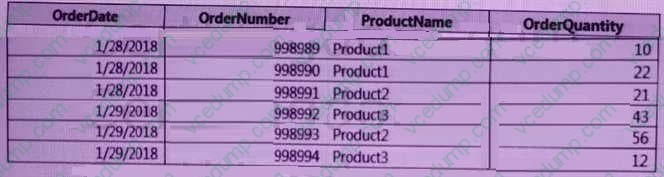
You need to retrieve a list of the unique ProductName entries.
Solution: Open the Advanced Filter dialog box, select Filter the list, in-place, and then select Unique records only.
Does this meet the goal?
A. Yes
B. No -
Question 106:
You have multiple workbook queries that load data from tables in Microsoft Azure SQL Database to a Power Pivot data model.
You discover that new rows were added to the tables in Azure SQL Database.
You need to ensure that the workbook has the new data.
Why should you do?
A. Select a cell in the worksheet and pressF5.
B. From the data tab, click Refresh All.
C. Close and open the workbook.
D. From the Power Pivot tab, click Update All. -
Question 107:
You install Microsoft Power BI Publisher for Excel.
You need to use Excel to connect and analyze Power BI data.
To which two types of Power BI data can you connect? Each correct answer presents a complete solution.
NOTE: Each correct selection is worth one point.
A. apps
B. datasets
C. reports
D. dashboard -
Question 108:
Note: This question is part of a series of questions that present the same scenario. Each question in the series contains a unique solution that might meet the stated goals. Some question sets might have more than one
correct solution, while others might not have a correct solution.
After you answer a question in this section, you will NOT be able to return to it. As a result, these questions will not appear in the review screen.
You have an Excel workbook that contains a table named Table1. A sample of the data in Table1 is shown in the following table.
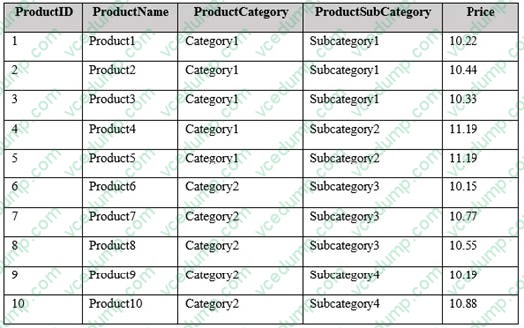
You need to create a PivotTable in PowerPivot as shown in the exhibit. (Click the Exhibit button.)
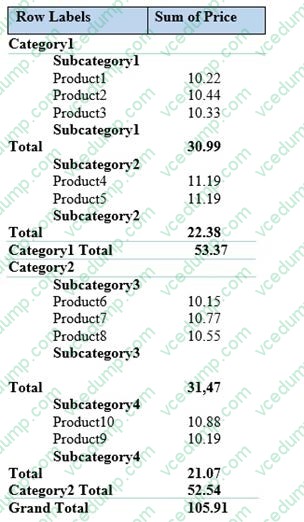
Solution: You create a measure named products the uses the DataTable DAX function. You add a PivotTable. You drag Products to the Rows field. You drag Price to the Values field. Does this meet the goal?
A. Yes
B. No -
Question 109:
You have the following data sample.
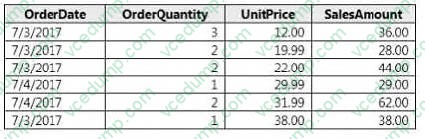
You need to create a PivotTable that presents the data as shown in the following table.
A. Create a PivotTable. Add UnitPrice to the Rows area and add SalesAmount to the Values area; Right-click a cell value for UnitPrice and modify the Group settings.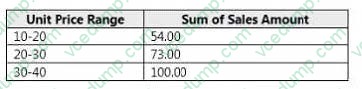
B. Create a PivotTable. Add SalesAmount to the Rows area and add UnitPrice to the Values area; Right-click a cell value for SalesAmount and modify the Group settings.
C. Create a PivotTable. Add UnitPrice to the Rows area and add SalesAmount to the Values area; Right-click a cell value for SalesAmount and modify the Field Settings.
D. Create a PivotTable. Add SalesAmount to the Rows area and add UnitPrice to the Values area; Right-click a cell value for UnitPrice and modify the Field Settings. -
Question 110:
You have the following table.
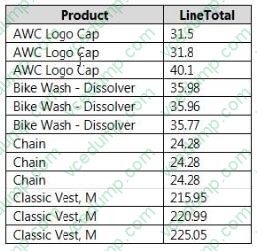
You need to create a PivotTable as shown in the following exhibit.
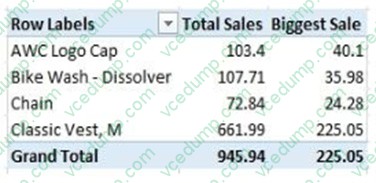
What should you do?
A. Add Product to the Rows area. Add LineTotal to the Values area twice.
B. Add LineTotal to the Rows area. Add Product to the Values area twice.
C. Add Product to the Rows area. Add LineTotal to the Columns area twice.
Related Exams:
-
62-193
Technology Literacy for Educators -
70-243
Administering and Deploying System Center 2012 Configuration Manager -
70-355
Universal Windows Platform – App Data, Services, and Coding Patterns -
77-420
Excel 2013 -
77-427
Excel 2013 Expert Part One -
77-725
Word 2016 Core Document Creation, Collaboration and Communication -
77-726
Word 2016 Expert Creating Documents for Effective Communication -
77-727
Excel 2016 Core Data Analysis, Manipulation, and Presentation -
77-728
Excel 2016 Expert: Interpreting Data for Insights -
77-731
Outlook 2016 Core Communication, Collaboration and Email Skills
Tips on How to Prepare for the Exams
Nowadays, the certification exams become more and more important and required by more and more enterprises when applying for a job. But how to prepare for the exam effectively? How to prepare for the exam in a short time with less efforts? How to get a ideal result and how to find the most reliable resources? Here on Vcedump.com, you will find all the answers. Vcedump.com provide not only Microsoft exam questions, answers and explanations but also complete assistance on your exam preparation and certification application. If you are confused on your 70-779 exam preparations and Microsoft certification application, do not hesitate to visit our Vcedump.com to find your solutions here.