1Z0-054 Exam Details
-
Exam Code
:1Z0-054 -
Exam Name
:Oracle Database 11g: Performance Tuning -
Certification
:Oracle Certifications -
Vendor
:Oracle -
Total Questions
:192 Q&As -
Last Updated
:Dec 09, 2021
Oracle 1Z0-054 Online Questions & Answers
-
Question 131:
You queried V$SYSTEM_EVENT in your online transaction processing (OLTP) environment to check the following wait events: Average Event Total Seconds Total Wait Name Waits Waiting Timeouts (in secs) ------------------------------ ------------ -------- ------------ --------- direct path read temp 18,274 11,312 16,282 .619 direct path write temp 3,251 416 25 .127
Which step would be appropriate to improve the performance?
A. Increase the number of I/O slaves.
B. Increase the size of the Database Buffer Cache.
C. Increase the size of the Program Global Area (PGA).
D. Increase the number of database writer (DBWn) processes. -
Question 132:
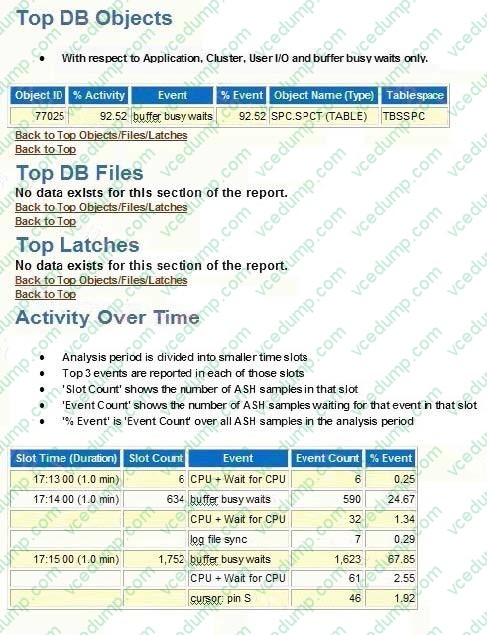
View Exhibit1 and examine a portion of Active Session History(ASH) report.
View Exhibit2 to examine the tablespaces.
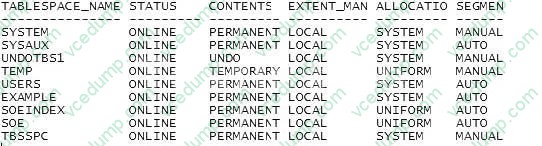
Which action would you suggest after analyzing the output?
A. Increase the log buffer size.
B. Rebuild indexes on SPCT table.
C. Decreasing the number of free lists in segment SPCT.
D. Move SPCT table to a different tablespace that is locally managed with automatic segment space management. -
Question 133:
View the Exhibit and examine the content. ALLOCATED_SPACE and FREE_SPACE are not matching with the TABLESPACE_SIZE value. What would you conclude from this?
A. A new temporary file is added to the tablespace.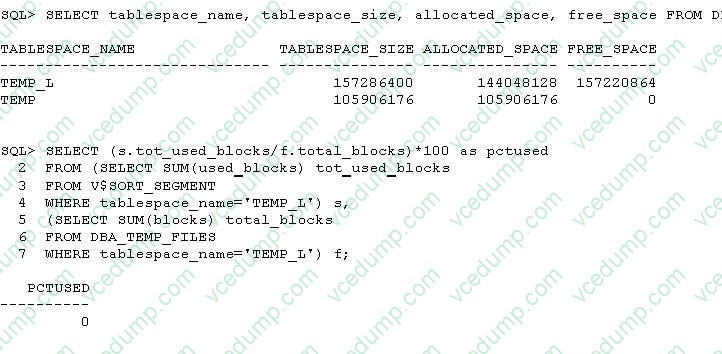
B. The temporary space was not sufficient for sort operations.
C. The temporary space allocated to large sort operations is not deallocated.
D. TEMP_L is a default temporary tablespace because the numbers show some overhead on this tablespace. -
Question 134:
You are working on a single node database. The storage for the database was recently upgraded to new, faster hard disks and new disk controllers. You ran the I/O calibration procedure to check the I/O metrics for the upgraded storage. The
details for the execution of the I/O calibration procedure are given below:
SQL>DECLARE
2l_latency INTEGER;
3l_iops INTEGER;
4l_mbps INTEGER;
5 BEGIN
6dbms_resource_manager.calibrate_io (1,10,l_iops,l_mbps,l_latency); 7 END;/
You queried the DBA_RSRC_IO_CALIBRATE data dictionary view to check the results of the I/O calibration. The output for the query is given as follows:
SQL> SELECT max_iops, max_mbps, max_pmbps, latency
FROM DBA_RSRC_IO_CALIBRATE;
MAX_IOPS MAX_MBPS MAX_PMBPS LATENCY
137 12 6 64
What do you infer from the output?
A. The actual latency is 10 milliseconds for one disk.
B. The maximum sustainable I/O for a single process is 12 MB per second.
C. The system can sustain a maximum of 137 I/O operations per second with a throughput of 6 MB per second.
D. The system can sustain a maximum of 137 I/O operations per second with a throughput of 12 MB per second. -
Question 135:
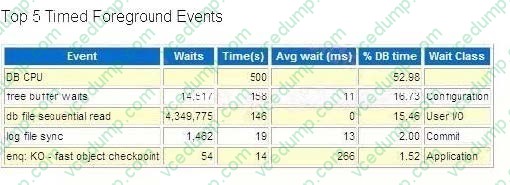
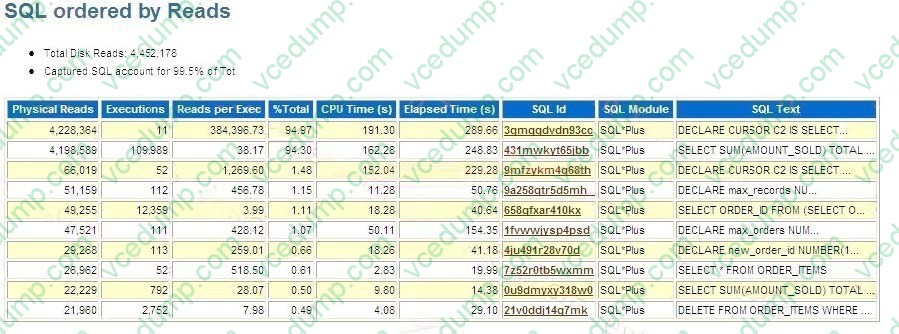
You are working on an online transaction processing (OLTP) system. You are investigating the reasons for performance degradation in the database. View the Exhibit named TOP5EVENTS and note the top five events.
View the Exhibit named TOPSQL and note the problems related to these statements.
View the Exhibit named INSTACT and note the table scans.
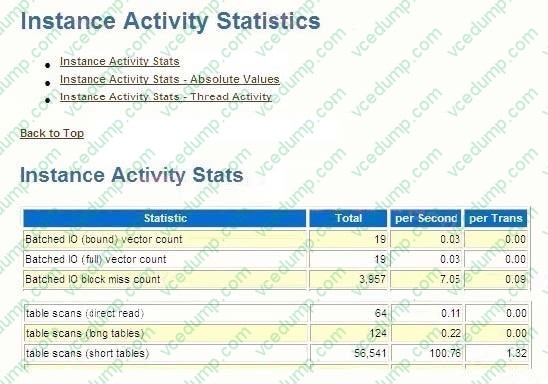
Which two are appropriate solutions to improve performance? (Choose two.)
A. Enable the large pool.
B. Keep the long tables in the keep buffer pool.
C. Keep the short tables in the keep buffer pool.
D. Set the CACHE property on the table for the long tables.
E. Set the CACHE property on the table for the short tables. -
Question 136:
While diagnosing performance problems for a database, you find Buffer Busy wait is the reason from V$ views. But the Automatic Database Diagnostic Monitor (ADDM) report does not reflect the Buffer Busy findings. Why does the Buffer Busy finding not appear in the ADDM report?
A. because an ADDM filter has been set
B. because the he USE_INDIRECT_DATA_BUFFERS parameter has been set to TRUE
C. because the DBIO_EXPECTED default task parameter for ADDM has been set to zero
D. because the CONTROL_MANAGEMENT_PACK_ACCESS parameter has been set to DIAGNOSTIC -
Question 137:
You observed very low cache-hit ratio in your database as shown below:
SQL> SELECT (1-((phy.value-phyd.value) / (cur.value + con.value))) * 100 2 "Cache Hit ratio"
3 FROM v$sysstat cur, v$sysstat con, v$sysstat phy, v$sysstat phyd 4 WHERE cur.name = 'db block gets'
5 AND con.name = 'consistent gets'
6 AND phy.name = 'physical reads'
7 AND phyd.name = 'physical reads direct';
Cache Hit Ratio
68.43
After further investigation, you decided to increase the database buffer cache size. You are using the
Buffer Cache Advisor to check the appropriate size for the buffer cache. View the Exhibit and examine the graph shown by the advisory.
What can you infer from the graph?
A. The buffer cache size can be set to 12 MB for optimal performance.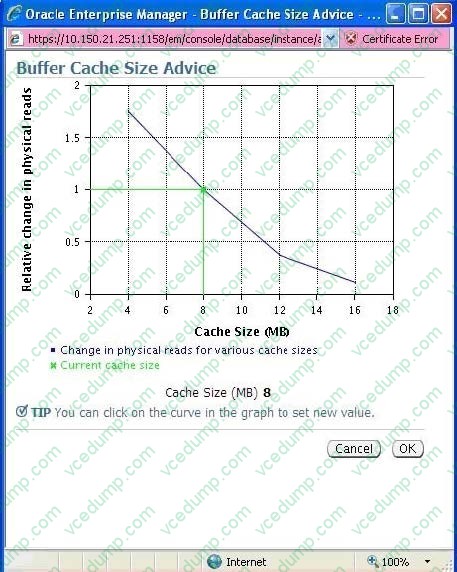
B. The buffer cache size can be set to more than 16 MB to get more benefit.
C. The buffer cache size can be set to more than 16 MB but there would be no benefit from it.
D. The buffer cache size cannot be set to more than 16 MB because the SGA_MAX_SIZE value does not allow that. -
Question 138:
You are working as a DBA on an online transaction processing (OLTP) system. This OLTP systems runs on a machine with a single CPU, on which applications primarily perform small random I/Os where each foreground process reads a data block into the buffer cache for updates and the changed blocks are written in batches by the DBWR process. You noticed the increase in I/O requests queued up against a disk, and an increase in the wait time in queue. What would you recommend to improve the latency of I/O requests?
A. Stripe data across multiple disks.
B. Increase the size of buffer cache.
C. Decrease the value of the DBWR_IO_SLAVES parameter.
D. Increase the value of the DB_WRITER_PROCESSES parameter. -
Question 139:
You observe that suboptimal execution plans for the queries are being generated on a table that previously used less resources. You have collected statistics on these tables two days ago. The optimizer statistics retention period is set to 31 days. You are able to find the timestamp information about statistics update from the DBA_TAB_STATS_HISTORY view. Because it is a frequently queried table, you would like the optimizer to generate better plans. Which action would enable you to use the previous set of statistics on the objects that may lead to better execution plans?
A. restoring statistics from statistics history up to the desired time
B. deleting all AWR snapshots collected after the time of desired statistics collection
C. applying the flashback table technique until the time of desired statistics collection
D. setting the OPTIMIZER_PENDING_STATISTICS parameter to TRUE to use the previous version of statistics -
Question 140:
View the Exhibit. Examine the query on the v$servicemetric view and the output.You wish to define a service-level threshold based on wall-clock time to monitor the performance of the service. Which metric should be used to set the appropriate threshold?
A. DELTA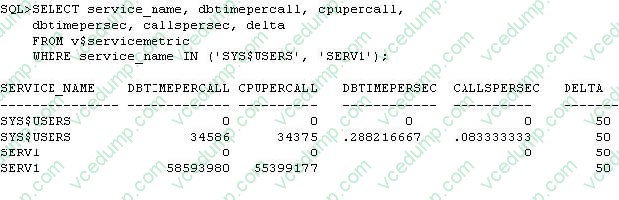
B. CPUPERCALL
C. CALLSPERSEC
D. DBTIMEPERSEC
E. DBTIMEPERCALL
Related Exams:
-
1Z0-020
Oracle8i: New Features for Administrators -
1Z0-023
Architecture and Administration -
1Z0-024
Performance Tuning -
1Z0-025
Backup and Recovery -
1Z0-026
Network Administration -
1Z0-034
Upgrade Oracle9i/10g OCA to Oracle Database OCP -
1Z0-036
Managing Oracle9i on Linux -
1Z0-041
Oracle Database 10g: DBA Assessment -
1Z0-052
Oracle Database 11g: Administration Workshop I -
1Z0-053
Oracle Database 11g: Administration II
Tips on How to Prepare for the Exams
Nowadays, the certification exams become more and more important and required by more and more enterprises when applying for a job. But how to prepare for the exam effectively? How to prepare for the exam in a short time with less efforts? How to get a ideal result and how to find the most reliable resources? Here on Vcedump.com, you will find all the answers. Vcedump.com provide not only Oracle exam questions, answers and explanations but also complete assistance on your exam preparation and certification application. If you are confused on your 1Z0-054 exam preparations and Oracle certification application, do not hesitate to visit our Vcedump.com to find your solutions here.