1Z0-054 Exam Details
-
Exam Code
:1Z0-054 -
Exam Name
:Oracle Database 11g: Performance Tuning -
Certification
:Oracle Certifications -
Vendor
:Oracle -
Total Questions
:192 Q&As -
Last Updated
:Dec 09, 2021
Oracle 1Z0-054 Online Questions & Answers
-
Question 1:
There are 500 users of an online transaction processing (OLTP) application that resides in your database. The system had been maintaining an average response rate of 10 seconds as specified by the Service-Level Agreement (SLA).This morning you were informed that for the past four days the average response time has gone up to 15-20 seconds. No changes have been made to the hardware or networking setup.What is the first thing that you should do to diagnose the cause of the slow response time?
A. Determine whether it is a memory configuration issue.
B. Determine whether the slow response is wait bound or CPU bound.
C. Determine whether the application is performing excessive I/O due to poor access path choice.
D. Determine whether new tablespaces have been created on the disks that are being used by the existing tablespaces. -
Question 2:
You are working for a company that uses huge applications to manage its customer details. During your regular performance checks, you executed the following query: SQL> show parameter shared_pool_reserved_size NAME TYPE VALUE ------------------------------ --------------------- ----------------- shared_pool_reserved_size big integer 6920601 SQL> SELECT free_space, used_space, request_misses, request_failures from V$SHARED_POOL_RESERVED; FREE_SPACE USED_SPACE REQUEST_MISSES REQUEST_FAILURES ---------- ---------- -------------- ---------------- 6469776 555528 0 113 You observed that REQUEST_FAILURES is 113 but not increasing, and also that REQUEST_MISSES is not increasing. What would you interpret from this?
A. The reserved pool is very large. Consider reducing the size of the shared pool.
B. The reserved pool is large and has free space to satisfy requests. Consider reducing the size of the reserved pool.
C. The reserved pool is very small and is not finding enough memory to satisfy requests. Increase the size of the shared pool.
D. The reserved pool is very small and is not finding enough memory to satisfy requests. Increase the size of the reserved pool. -
Question 3:
View the Exhibit and note the workload type selected to quickly configure the metric threshold. Which statement describes the result after finishing this quick configuration process?
A. It sets thresholds for all basic metrics.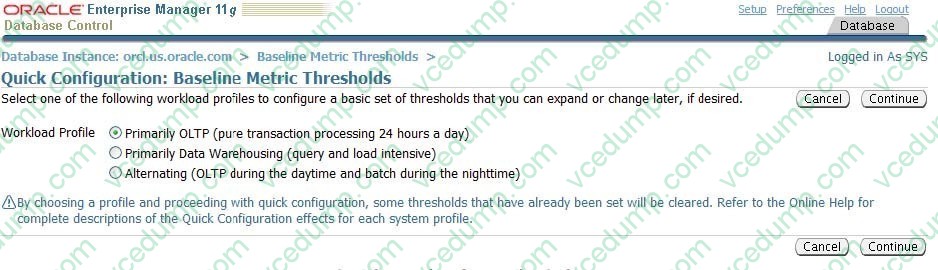
B. All thresholds set are of the Significance Level type.
C. It uses only the SYSTEM_MOVING_WINDOW baseline for thresholds.
D. The thresholds set by the quick configuration process are of the Fixed Value type. -
Question 4:
Which two symptoms related to the database buffer cache together indicate that there are many full table scans happening? (Choose two.)
A. too many buffer busy waits
B. very low buffer cache-hit ratio
C. very high buffer cache-hit ratio
D. many waits on the db file scattered read event -
Question 5:
You have the automatic optimizer statistics gathering enabled for a 24x7 database as part of the automatic maintenance task. You observed that a few tables are being updated regularly, but not being queried often. However statistics are being gathered for these tables automatically and regularly, thereby affecting the database performance. What would you do to increase the interval of statistics collection for these tables so that the statistics collection jobs spend less time during the automatic maintenance task?
A. Set the OPTIMIZER_USE_PENDING parameter statistics to TRUE.
B. Increase the value of the STALE_PERCENT preference for these tables.
C. Mark those associated indexes that are less frequently used as invisible.
D. Increase the value of the ESTIMATE_PERCENT preference for these tables -
Question 6:
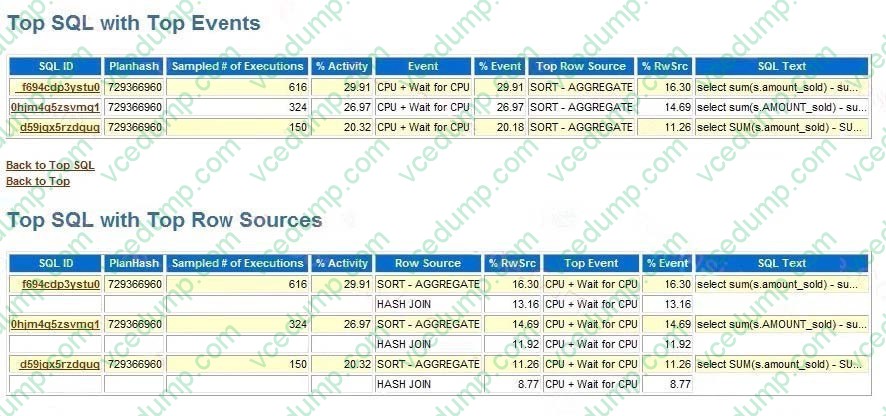
You noticed a high number of SQL statements with the same PLAN_HASH_VALUES. View Exhibit1 to see the details.
View Exhibit2 to see the details of the SQL text for the statements.
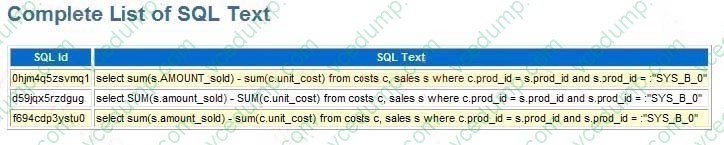
What do you infer from the results?
A. The statements are using the same cursor.
B. The statements are not using the same cursor.
C. Removing the bind variable would improve performance.
D. The cursor for the statement is aging out of the shared pool very quickly. -
Question 7:
As a DBA, you notice that the response time of your database has degraded. Which two pieces of tuning-related information can you examine in the alert log to identify possible causes? (Choose two.)
A. frequency of log switches
B. frequency of block corruption errors
C. concurrent parsing and buffer cache latch contention
D. the amount of CPU time spent on database user-level calls -
Question 8:
Identify the type of recommendation that can automatically be implemented by the Automatic Tuning Advisor as part of automatic SQL tuning task?
A. recommendation for SQL profiles
B. recommendation about effective indexing
C. recommendation about stale or no statistics
D. recommendation about the structure of SQL statements -
Question 9:
What is the purpose of running the statspack.snap script during the installation of the Statspack package?
A. It creates the initial baseline.
B. It automates the collection of statistics.
C. It stores the current performance statistics in the Statspack tables.
D. It creates the PERFSTAT user, the Statspack tables, and constraints -
Question 10:
You identified poorly performing SQL by analyzing the V$SQL and V$SQLSTATS views. You want to investigate the plans for these SQL statements.Which two methods can you use to pull out the execution plan from the library cache for the already executed SQL? (Choose two.)
A. Query V$SQL_PLAN to view the execution plan.
B. Query DBA_HIST_SQL_PLAN to view the execution plan.
C. Copy and paste the SQL text from the V$SQL view and use EXPLAIN PLAN to generate the execution plan.
D. Use the dbms_xplan.display_cursor function with the SQL ID and child number to generate the execution plan.
Related Exams:
-
1Z0-020
Oracle8i: New Features for Administrators -
1Z0-023
Architecture and Administration -
1Z0-024
Performance Tuning -
1Z0-025
Backup and Recovery -
1Z0-026
Network Administration -
1Z0-034
Upgrade Oracle9i/10g OCA to Oracle Database OCP -
1Z0-036
Managing Oracle9i on Linux -
1Z0-041
Oracle Database 10g: DBA Assessment -
1Z0-052
Oracle Database 11g: Administration Workshop I -
1Z0-053
Oracle Database 11g: Administration II
Tips on How to Prepare for the Exams
Nowadays, the certification exams become more and more important and required by more and more enterprises when applying for a job. But how to prepare for the exam effectively? How to prepare for the exam in a short time with less efforts? How to get a ideal result and how to find the most reliable resources? Here on Vcedump.com, you will find all the answers. Vcedump.com provide not only Oracle exam questions, answers and explanations but also complete assistance on your exam preparation and certification application. If you are confused on your 1Z0-054 exam preparations and Oracle certification application, do not hesitate to visit our Vcedump.com to find your solutions here.