Q81
Hotspot
HOTSPOT
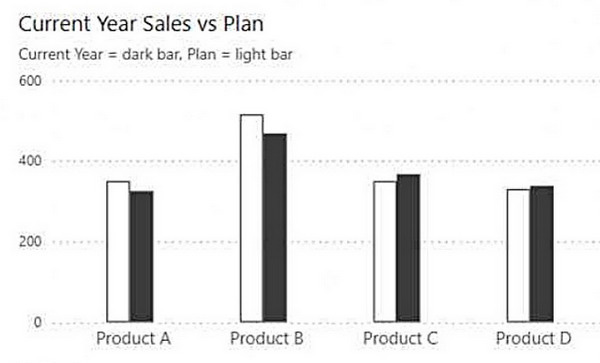
You have a Power BI report that contains the visual shown in the following exhibit.
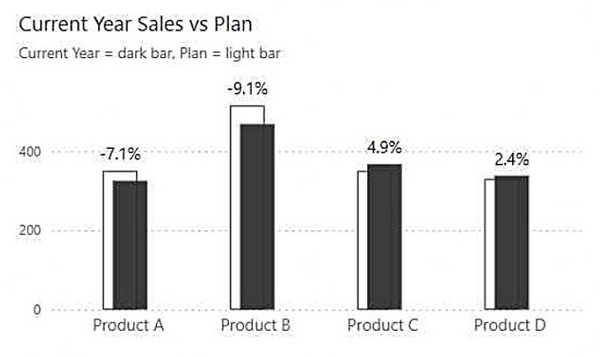
You plan to modify the visual by changing the column spacing and adding percent change labels as shown in the following exhibit.
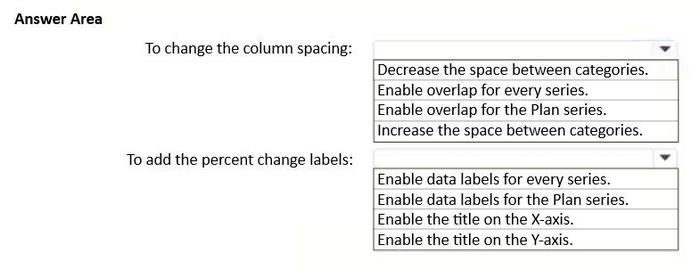
What should you do? To answer, select the appropriate options in the answer area.
NOTE: Each correct selection is worth one point.
Select the correct area(s) on the image.