Q54
Single choice
You have a Power Bl semantic model named Model! that contains two fields named Sales and Quarter.
Model 1 contains a DAX measure that sums the Sales column.
You need to create a report that will contain the visual shown in the following exhibit.
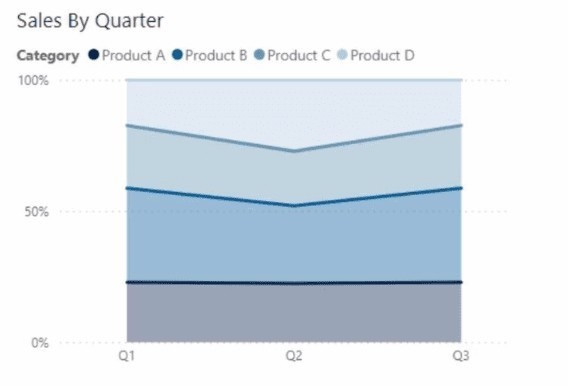
The solution must NOT require additional DAX measures.
Which type of visual should you use?