PL-300 Web TestEngine demo

Exit VCEDump PL-300 Microsoft Power BI Data Analyst
Question 52 of 82
0% complete
Q52 Single choice

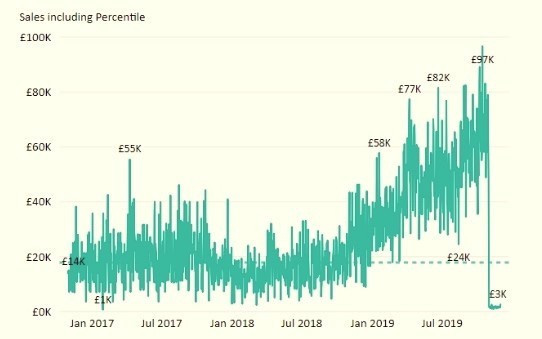
You plan to create the chart shown in the following exhibit.
Question 52 diagram

How should you create the dashed horizontal line denoting the 40th percentile of daily sales for the period shown?

Sign in to mark questions

Sign in to save marked questions and return to this demo.

Sign in