Exam Details
Exam Code
:TDA-C01Exam Name
:Tableau Certified Data AnalystCertification
:Tableau CertificationsVendor
:TableauTotal Questions
:117 Q&AsLast Updated
:Jun 29, 2025
Tableau Tableau Certifications TDA-C01 Questions & Answers
-
Question 31:
You have the Mowing dashboard.
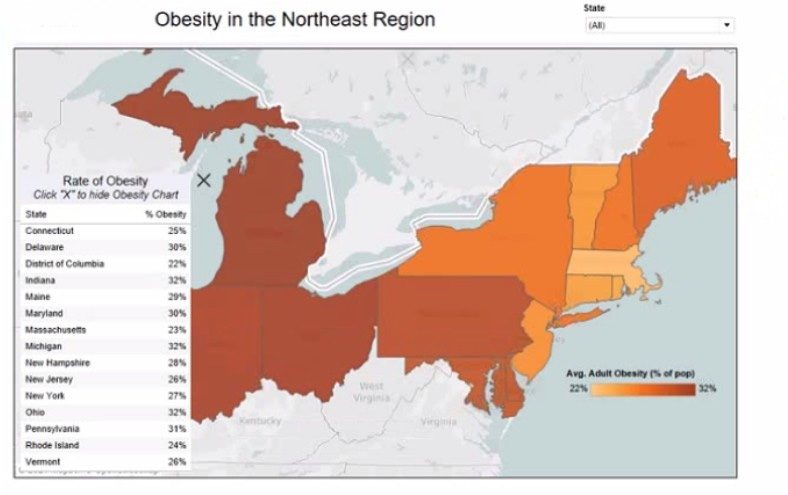
Which two elements are floating? Choose two.
A. The state filter
B. The color legend C. The map
D. The Rate of Obesity chart
E. The little
-
Question 32:
You have a line chart on a worksheet.
You want to add a comment to March 2020 as shown in the following visualization.
What should you do?

A. Drag the growth rate to Text on the Marks card
B. Enable captions
C. Annotate March 2020
D. Add a tooltip
-
Question 33:
You have the following dataset.
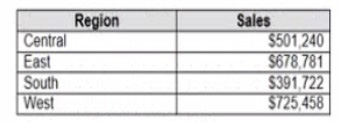
Which Level of Detail (LOD) expression should you use to calculate tie grand total of all the regions?
A. {FIXED: [Region] SUM Sales}
B. {FIXED: SUM Sales}
C. {Fixed: [Region]: TOTAL Sales}
D. {FIXED: TOTAL (Sales)}
-
Question 34:
You have a dashboard that contains confidential information about patients health. The data needs to always be up to date tor a team of healthcare workers. How should you share me dashboard with the healthcare workers?
A. Publish the dashboard to Tableau Public
B. Print the dashboard to PDF
C. Publish aw dashboard to Tableau Server
D. Export the dashboard as a .twbx
-
Question 35:
You want to connect a Tableau workbook to a dataset in a Microsoft Excel spreadsheet. What should you do from Tableau Desktop?
A. From the Data menu select New Data Source
B. From the Data menu select Replace Data Source
C. From the File menu select Import Workbook
D. From the File menu select New
-
Question 36:
You have a database that includes field named sales, City and Region.
You have the following chart that shows the number of sales made in different cities.

You want to dynamically show the corresponding region when users hover their mouse over any of the bars. What should you do?
A. Right-click a in the chat, select Annotate and then select Mark.
B. Right-click a bar in the chart select Mark Label and then select Always show.
C. Edit the aliases for City.
D. Drag Region to Tooltip on the Marks card
-
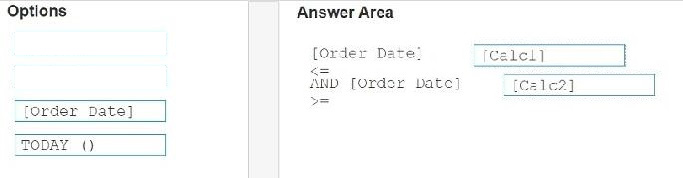
Question 37:
DRAG DROP
You have the following calculated fields in a worksheet.
[Calc1] = DATEADD ('year', -1, TODAY ())
[Calc2] = DATETRUNC ( 'month' , DATEADD ('year', -1, TODAY ())
You want to calculate the month to date value of the prior year.
How should you complete the formula? (Drag the appropriate Options to the Answer Area and drop into the correct locations.)
Select and Place:
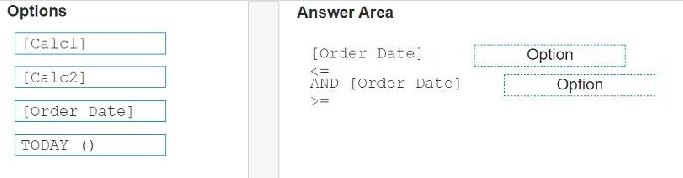
-
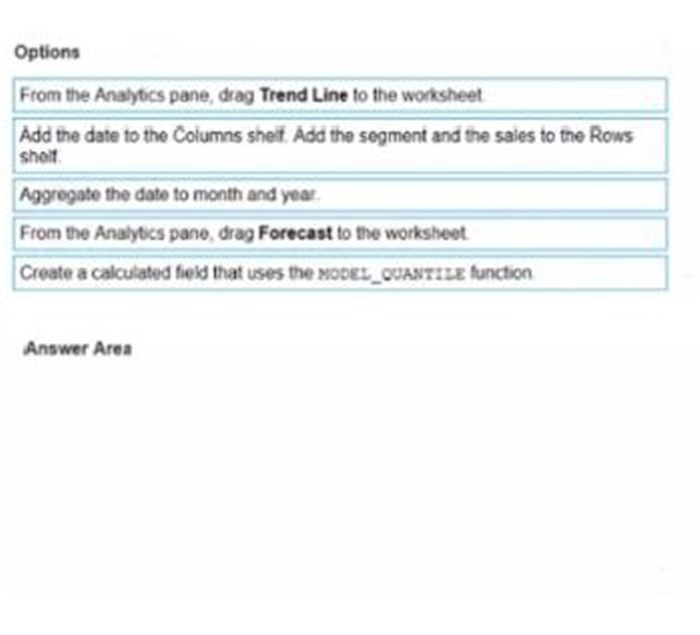
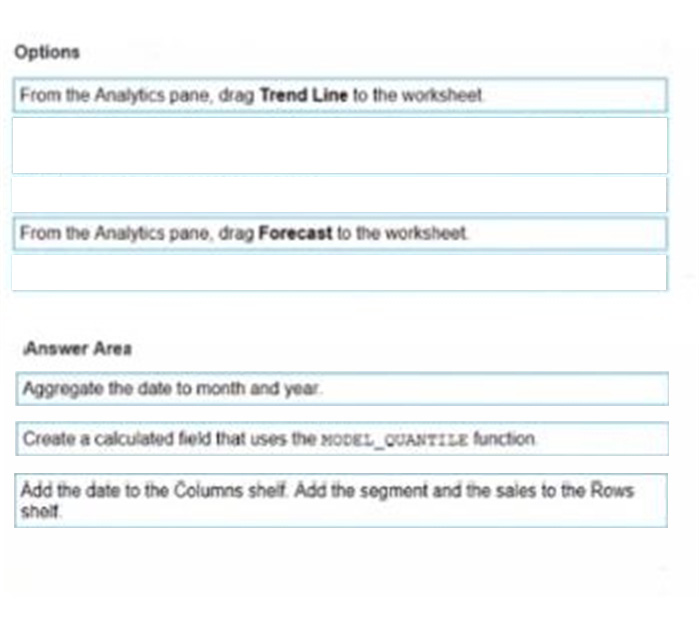
Question 38:
You have a dataset that contains daily sales by business segment from 2017 to the present You want to use monthly historical trends to predict sales by segment in the future.
Which three actions should you perform m order?
(Place the three correct options in order Use the arrows to move Options in Answer Area arrows to re order the options.)
Select and Place:
-
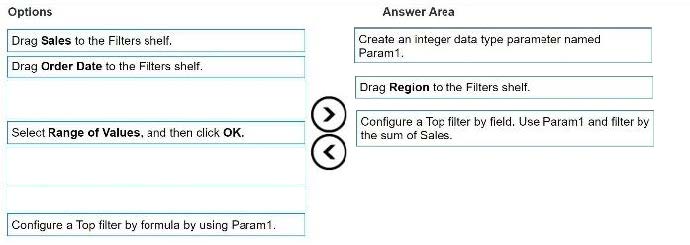
Question 39:
DRAG DROP
You have a data source that contains the following columns.
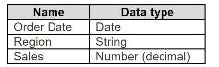
You want to filter regions based on the highest sales. Users must be able to specify the number of regions shown.
Which three actions should you perform in order? (Place the three correct options in order.
Use the arrows to move Options to Answer Area.
Use Answer Area arrows to re-order the options.)
Select and Place:
-
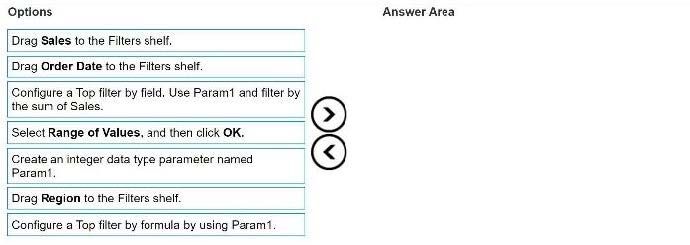
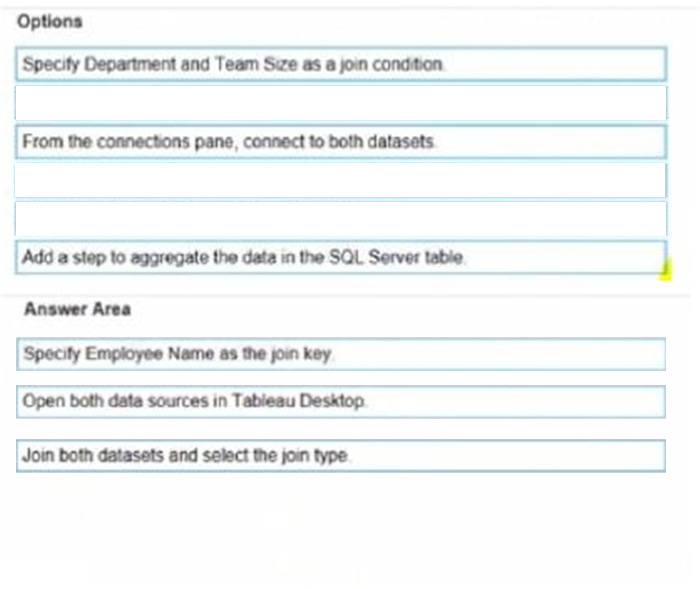
Question 40:
You have the following two datasets:
A Microsoft Excel worksheet that has two columns named Employee Name and Department
A Microsoft SQL Server table that has three columns named Employee Name. Pay Grade and Team Size.
You want to use Tableau Prep to join the two datasets.
Which three actions should you perform m order? (Place the three correct options in order.)
Select and Place:
Tips on How to Prepare for the Exams
Nowadays, the certification exams become more and more important and required by more and more enterprises when applying for a job. But how to prepare for the exam effectively? How to prepare for the exam in a short time with less efforts? How to get a ideal result and how to find the most reliable resources? Here on Vcedump.com, you will find all the answers. Vcedump.com provide not only Tableau exam questions, answers and explanations but also complete assistance on your exam preparation and certification application. If you are confused on your TDA-C01 exam preparations and Tableau certification application, do not hesitate to visit our Vcedump.com to find your solutions here.