Exam Details
Exam Code
:TDA-C01Exam Name
:Tableau Certified Data AnalystCertification
:Tableau CertificationsVendor
:TableauTotal Questions
:117 Q&AsLast Updated
:Jun 29, 2025
Tableau Tableau Certifications TDA-C01 Questions & Answers
-
Question 21:
You have the following dashboard.
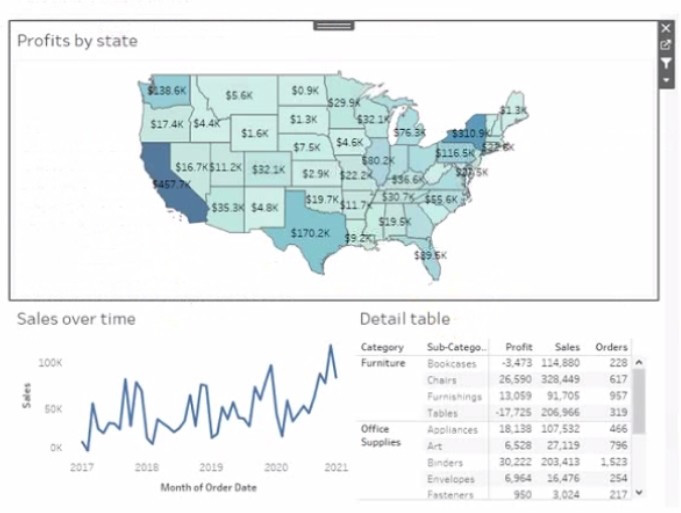
Currently the map is used as a filter that affects the data on the otter sheets of the dashboard
You need to configure the dashboard to ensure that selecting a data point on the map only tillers the Detail table
What should you do?
A. From the context menu of Sales over time select Ignore Actions
B. From the context menu of Sales over lime select Remove Dashboard Item
C. From the context menu of Profits by Stale deselect Use as Filter
D. From the context menu of Sales over time select Deselect
-
Question 22:
You have the following box plot that shows the distribution of average profits made in every state by region.
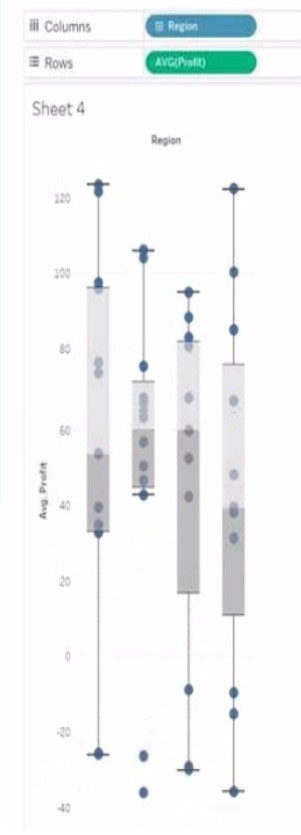
Which region has the smallest distribution of profits?
A. South
B. Cast
C. Central
D. West
-
Question 23:
You are the owner of an alert.
You receive an email notification that the alert was suspended From where can you resume the suspended alert?
A. The Data Source page of Tableau Desktop
B. The Notification area of Tableau Prep
C. The My Content area of Tableau web pages
D. The Shared with Ma page
-
Question 24:
You have the following tiled dashboard that has one sheet.
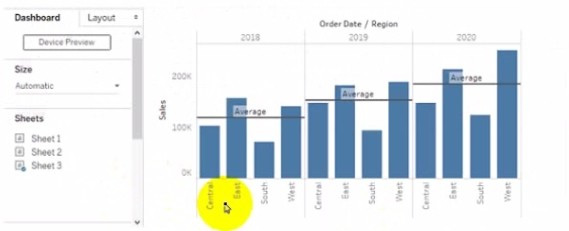
You want to replace fit sheet with Sheet2. What should you do?
A. Right-click Sheet2 and select Add to Dashboard.
B. Select Sheets and click the Swap Sheet button next to Sheet2.
C. From the context menu of Sheet3. select Remove Dashboard item
D. Drag Sheet2 to the dashboard.
E. From the context menu of Sheet3. select Deselect
-
Question 25:
You plan to create a visualization that has a dual axis chart. The dual axis chart will contain a shape chart and a line chart will use the same measure named Population on the axis.
You need to configure be shapes to be much larger than the line.
What should you do?
A. Duplicate Population Drag the duplicate to the second Marks card and configure the see of the marks independently
B. Create a custom shape that is larger than the default shape and add the shape to the Shapes folder in My Repository
C. For the second axis select Shape on the Marks card From Select Shape Palette select Custom and then select Reset
D. Change Population to a discrete dimension
-
Question 26:
You have the following data source in tableau Server.
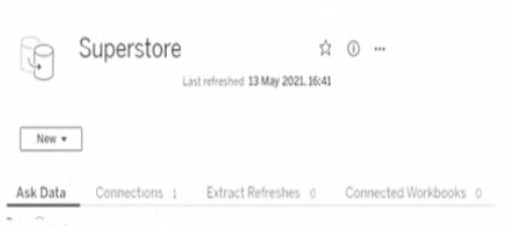
You need to ensure that the data is updated every hour. What should you select?
A. New
B. Extract Refreshes
C. Connected Workbooks
D. Connections
-
Question 27:
You have the following dashboard that contains two visualizations.

You want to show only visualization at time. Users must be able to switch between visualizations. What should you me?
A. A parameter and a calculated filed
B. Worksheet actions
C. Showhide buttons
D. Dashboard actions
-
Question 28:
You have the following line chart that shows the average sales by month.

Which month had the biggest increase in swage sales compared to me previous month in 2019?
A. August
B. October
C. December
D. November
-
Question 29:
A colleague provides you with access to a folder that contains the following files:
Sates.csv Bookl.twb Sates.hyper Export.mdb
Which He contains an extract?
A. Export mdb
B. Book1.twb
C. Sales.hyper
D. Sales.csv
-
Question 30:
You want to add a comment to March 2020 as shown in the following visualization. You have the following sets in a Tableau workbook ?Top N Customers Customers of 2020
Top N Products Sellers of 2020 Which two sets can you combine? Choose two
A. Sellers of 2020
B. Customers of 2020
C. Top N Products
D. Top N Customers
Tips on How to Prepare for the Exams
Nowadays, the certification exams become more and more important and required by more and more enterprises when applying for a job. But how to prepare for the exam effectively? How to prepare for the exam in a short time with less efforts? How to get a ideal result and how to find the most reliable resources? Here on Vcedump.com, you will find all the answers. Vcedump.com provide not only Tableau exam questions, answers and explanations but also complete assistance on your exam preparation and certification application. If you are confused on your TDA-C01 exam preparations and Tableau certification application, do not hesitate to visit our Vcedump.com to find your solutions here.