PL-300 Exam Details
-
Exam Code
:PL-300 -
Exam Name
:Microsoft Power BI Data Analyst -
Certification
:Microsoft Certifications -
Vendor
:Microsoft -
Total Questions
:546 Q&As -
Last Updated
:Jul 15, 2026
Microsoft PL-300 Online Questions & Answers
-
Question 431:
You have a BI dataset and a connected report.
You need to ensure that users can analyze data in Microsoft Excel by connecting directly to the dataset.
You grant the users the Build permission for dataset What Should do next?
A. Change default visual interaction for the report
B. For the report change the Export data setting to Summarized data, data with current layout and underlying data
C. For the report, change the Export data setting to None
D. Certify the dataset used by the report. -
Question 432:
DRAG DROP
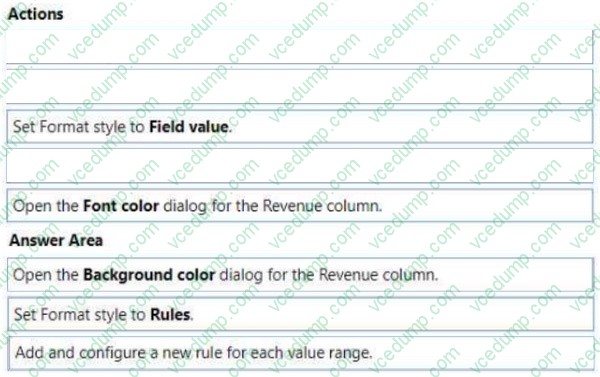
You have a Power BI report that contains a table visual with a measure named Revenue. The Revenue measure returns values within a range of 0 to 5.
You need to format the visual so that the Revenue column displays a specific background color based on the value range shown in the following table.
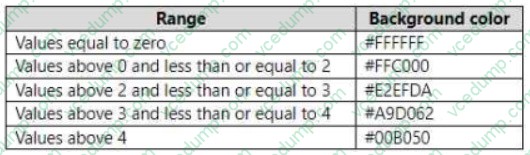
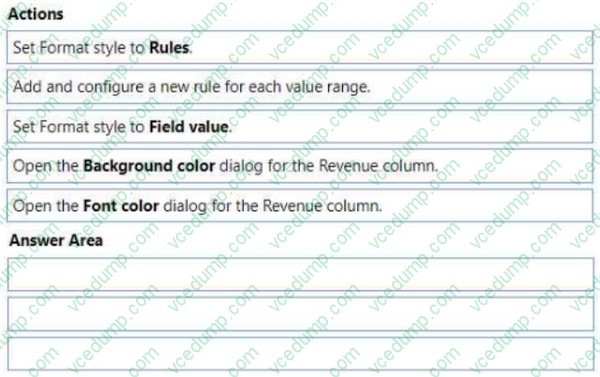
Which three actions should you perform in sequence in Power BI Desktop? To answer, move the appropriate actions from the list of actions to the answer area and arrange them in the correct order.
Select and Place:
-
Question 433:
You are creating a visual in a Power BI report. The associated semantic model contains sales from the last four years for three products.
You need to display the total sales by quarter categorized by product. The visual must display trends in both total sales and individual product sales.
Which type of visual should you use?
A. area chart
B. clustered column chart
C. stacked area chart
D. line chart -
Question 434:
You need to create a calculated column to display the month based on the reporting requirements.
Which DAX expression should you use?
A. FORMAT('Date'[date], "MMM YYYY")
B. FORMAT('Date' [date], "M YY")
C. FORMAT('Date'[date_id], "MMM") & "" & FORMAT('Date'[year], "#")
D. FORMAT('Date' [date_id], "MMM YYYY") -
Question 435:
HOTSPOT
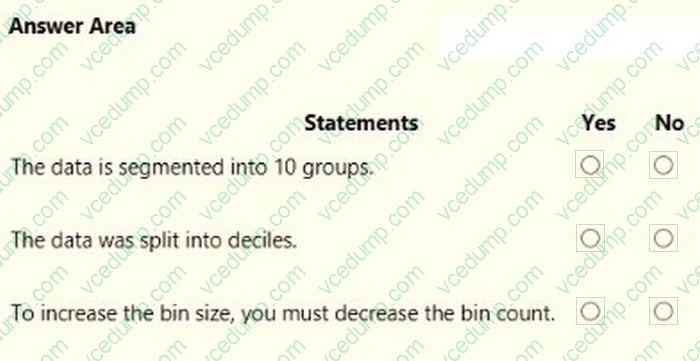
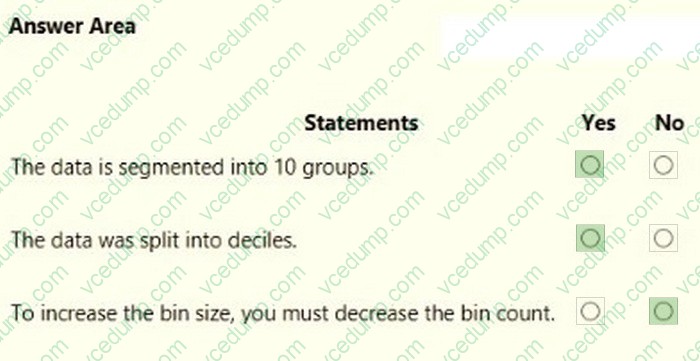
You are creating a column chart visualization.
You configure groups as shown in the Groups exhibit. {Click the Groups tab.)
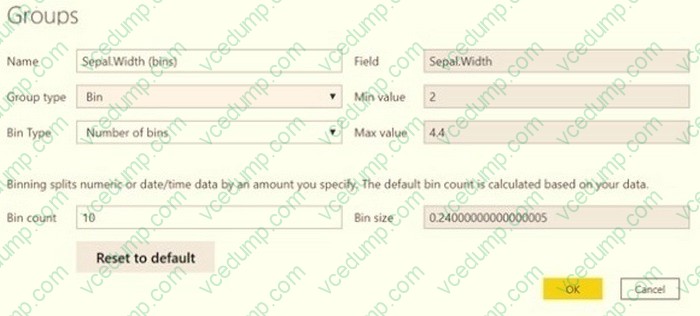
The visualization appears as shown in the Chart exhibit. (Click the Chart tab.)
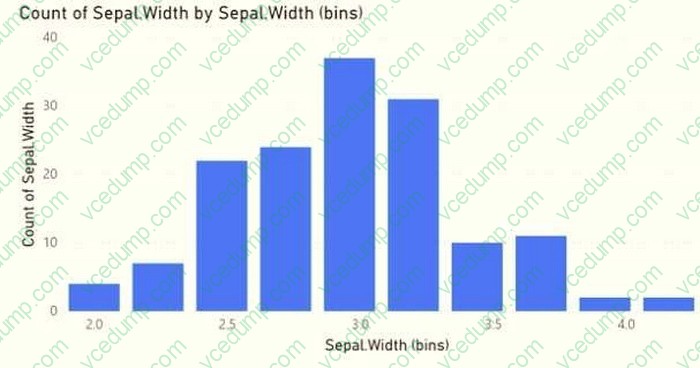
For each of the following statements, select Yes if the statement is true. Otherwise, select No.
NOTE: Each correct selection is worth one point.
-
Question 436:
You need to get data from the Microsoft SQL Server tables.
What should you use to configure the connection?
A. import that uses a Microsoft account
B. DirectQuery that uses the end-user s credentials
C. DirectQuery that uses a database credential
D. Import that uses a database credential -
Question 437:
You plan to use Power Bl Desktop to create a bog tracking dashboard that will pull data from Analytics in Azure DevOps.
From Power Bl Desktop, you need to configure a data connector to authenticate to Azure DevOps. The solution must meet the following requirements:
1. Use Analytics views.
2. Filter data from the cloud.
Which connector should you use?
A. OData queries
B. Azure DevOps (Boards only)
C. Azure DevOps Server (Boards only)
D. OData feed -
Question 438:
HOTSPOT
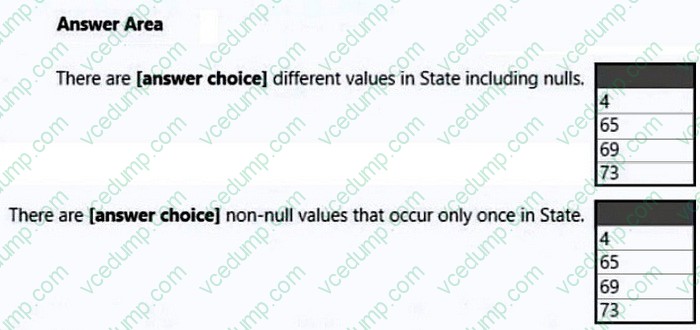
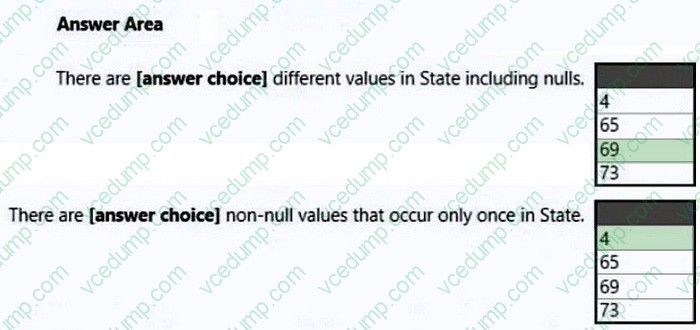
You are profiling data by using Power Query Editor.
You have a table named Reports that contains a column named State. The distribution and quality data metrics for the data m State is shown in the following exhibit.
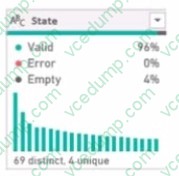
Use the drop-down menus to select the answer choice that completes each statement based on the information presented in the graphic.
NOTE: Each correct selection is worth one point.
-
Question 439:
Note: This question is part of a series of questions that present the same scenario. Each question in the series contains a unique solution that might meet the stated goals. Some question sets might have more than one correct solution, while others might not have a correct solution.
After you answer a question in this scenario, you will NOT be able to return to it. As a result, these questions will not appear in the review screen.
You have several reports and dashboards in a workspace.
You need to grant all organizational users read access to a dashboard and several reports.
Solution: You assign all the users the Viewer role to the workspace.
Does this meet the goal?
A. Yes
B. No -
Question 440:
You are building a Power BI report to analyze customer segments.
You need to identify customer segments dynamically based on the Bounce Rate across dimensions such as source, geography, and demographics. The solution must minimize analysis effort.
Which type of visualization should you use?
A. decomposition tree
B. funnel chart
C. Q&A
D. key influencers
Related Exams:
-
62-193
Technology Literacy for Educators -
70-243
Administering and Deploying System Center 2012 Configuration Manager -
70-355
Universal Windows Platform – App Data, Services, and Coding Patterns -
77-420
Excel 2013 -
77-427
Excel 2013 Expert Part One -
77-725
Word 2016 Core Document Creation, Collaboration and Communication -
77-726
Word 2016 Expert Creating Documents for Effective Communication -
77-727
Excel 2016 Core Data Analysis, Manipulation, and Presentation -
77-728
Excel 2016 Expert: Interpreting Data for Insights -
77-731
Outlook 2016 Core Communication, Collaboration and Email Skills
Tips on How to Prepare for the Exams
Nowadays, the certification exams become more and more important and required by more and more enterprises when applying for a job. But how to prepare for the exam effectively? How to prepare for the exam in a short time with less efforts? How to get a ideal result and how to find the most reliable resources? Here on Vcedump.com, you will find all the answers. Vcedump.com provide not only Microsoft exam questions, answers and explanations but also complete assistance on your exam preparation and certification application. If you are confused on your PL-300 exam preparations and Microsoft certification application, do not hesitate to visit our Vcedump.com to find your solutions here.