PL-300 Exam Details
-
Exam Code
:PL-300 -
Exam Name
:Microsoft Power BI Data Analyst -
Certification
:Microsoft Certifications -
Vendor
:Microsoft -
Total Questions
:546 Q&As -
Last Updated
:Jul 15, 2026
Microsoft PL-300 Online Questions & Answers
-
Question 371:
Note: This question is part of a series of questions that present the same scenario. Each question in the series contains a unique solution that might meet the stated goals. Some question sets might have more than one correct solution, while others might not have a correct solution. After you answer a question in this section, you will NOT be able to return to it. As a result, these questions will not appear in the review screen.
You have a Power BI report that imports a date table and a sales table from an Azure SQL Database data source. The sales table has the following date foreign keys:
Due Date
Order Date
Delivery Date
You need to support the analysis of sales over time based on all three dates at the same time.
Solution: You create measures that use the USERELATIONSHIP DAX function to filter sales on the inactive relationships between the sales table and the date table.
Does this meet the goal?
A. Yes
B. No -
Question 372:
In Power Query Editor, you have a query named Sales Data that contains the following columns.
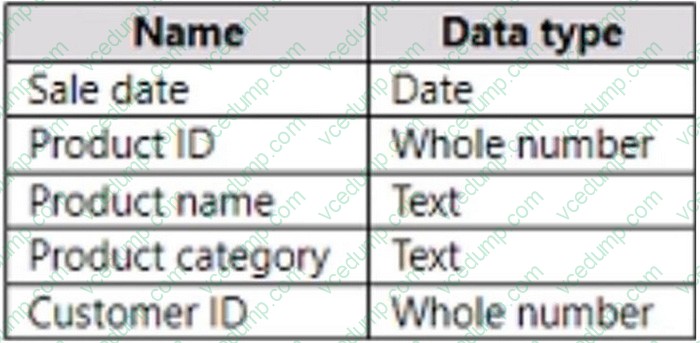
You need to create two queries named Product Dimension and Sales Fact based on the Sales Data query. The solution must minimize maintenance effort and the size of the dataset.
Which two actions should you perform? Each correct answer presents part of the solution.
NOTE: Each correct selection is worth one point.
A. Reference the Sales Data query to create the new queries.
B. Disable the load for the Sales Fact query.
C. Duplicate the Sales Data query to create the new queries.
D. Clear Include in report refresh for the Sales Data query.
E. Disable the load for the Sales Data query. -
Question 373:
HOTSPOT
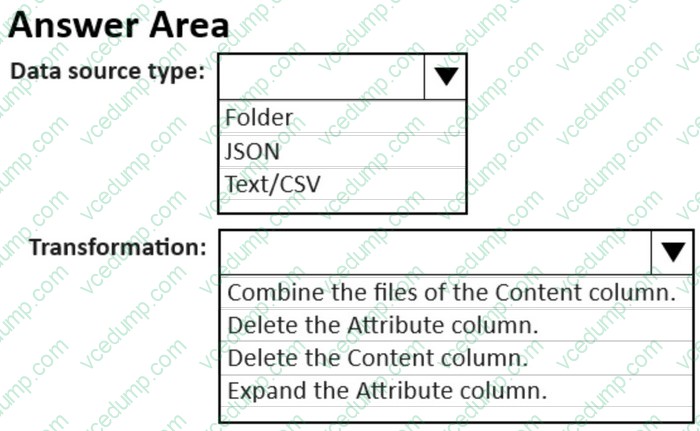
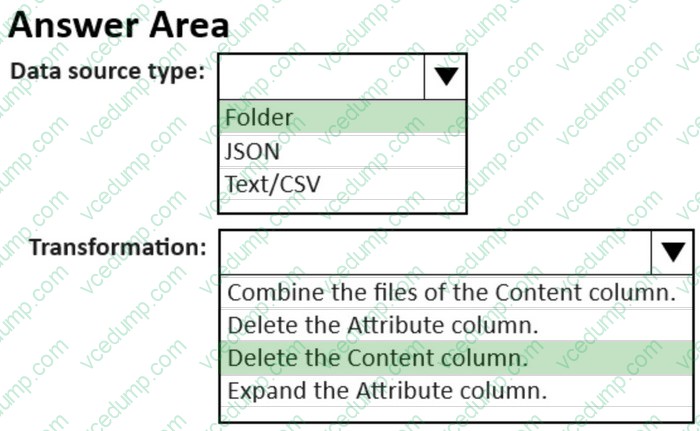
You hove a folder that contains 50 JSON files.
You need to use Power 81 Desktop to make the metadata ol the files available as a single semantic model. The solution must NOT store the data of the JSON files.
Which type of data source should you use. and which transformation should you perform? To answer, select the appropriate options in the answer area.
NOTE: Each correct selection is worth one point.
-
Question 374:
You have a Power BI semantic model named Model1 that runs in Import storage mode.
You need to reduce the size of Model1. The solution must NOT increase report query response times.
What should you do?
A. Remove unnecessary columns.
B. Unpivot unnecessary columns.
C. Rename unnecessary columns.
D. Change Model1 to DirectQuery storage mode. -
Question 375:
DRAG DROP
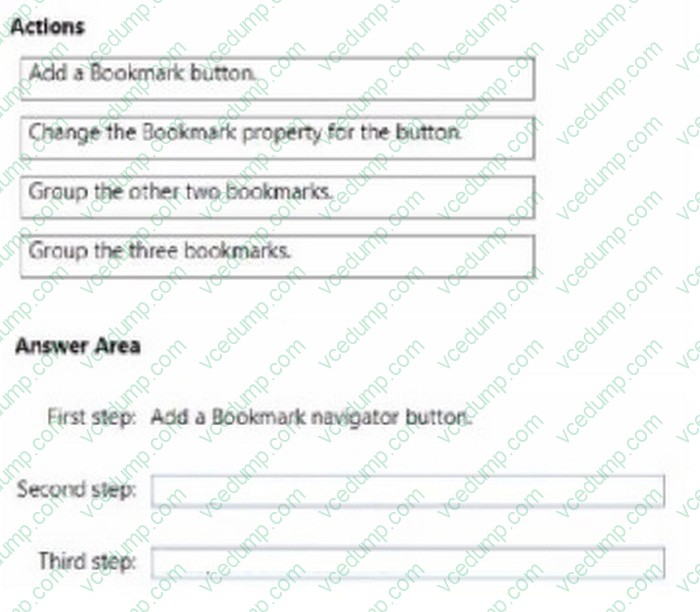
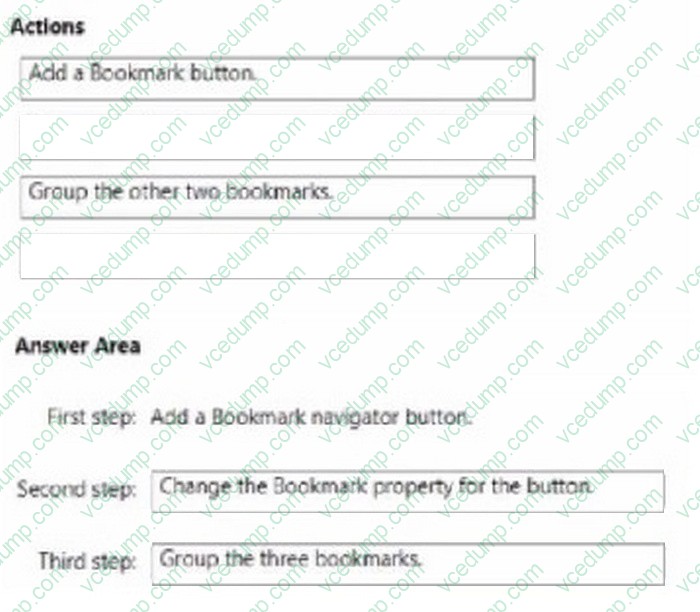
You have a Power Bi report that contains five bookmarks.
You need to add an object to the report from which users can navigate between three specific bookmarks.
How should you complete the task? To answer, drag the appropriate actions to the correct steps, each action may be used once more than once, or not at all. You may need to drag the split bar between panes or scroll lo view content.
NOTE: Each correct selection is worth one point.
Select and Place:
-
Question 376:
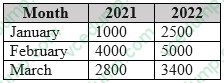
You have the CSV file shown in the following table.
You use Power Query Editor to preview the data in the file.
You need to transform the data to meet the following requirements:
1. The first column must contain the month.
2. The second column must contain the year.
3. The third column must contain the order amount for the month and year.
Which transformation should you use first?
A. unpivot
B. pivot
C. transpose
D. remove -
Question 377:
Note: This question is part of a series of questions that present the same scenario. Each question in the series contains a unique solution that might meet the stated goals. Some question sets might have more than one correct solution, while others might not have a correct solution.
After you answer a question in this section, you will NOT be able to return to it. As a result, these questions will not appear in the review screen.
From Power Query Editor, you profile the data shown in the following exhibit.
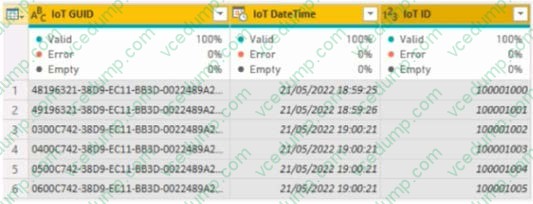
The IOT ID columns are unique to each row in query.
You need to analyze 10T events by the hour and day of the year. The solution must improve dataset performance.
Solution: You change the IOT DateTime column to the Date data type.
Does this meet the goal?
A. Yes
B. No -
Question 378:
HOTSPOT
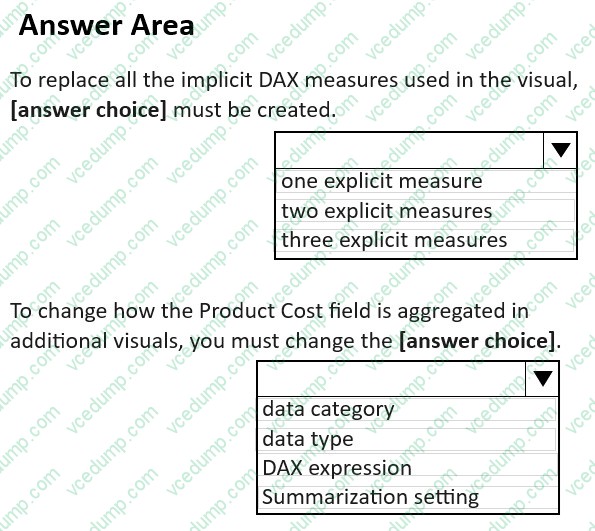
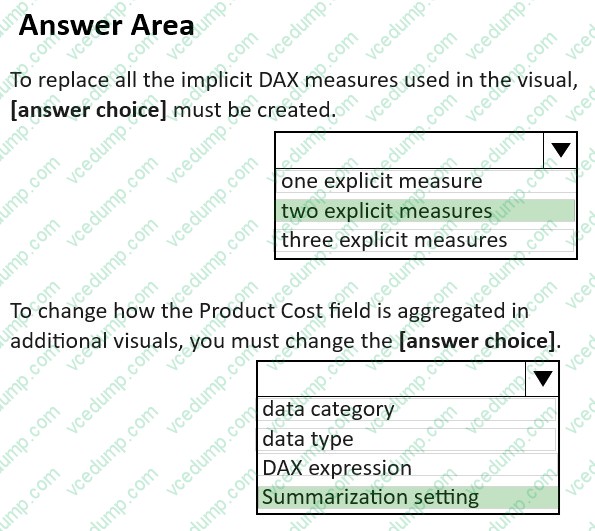
You have Power BI report that contains the fields shown in the following exhibit.
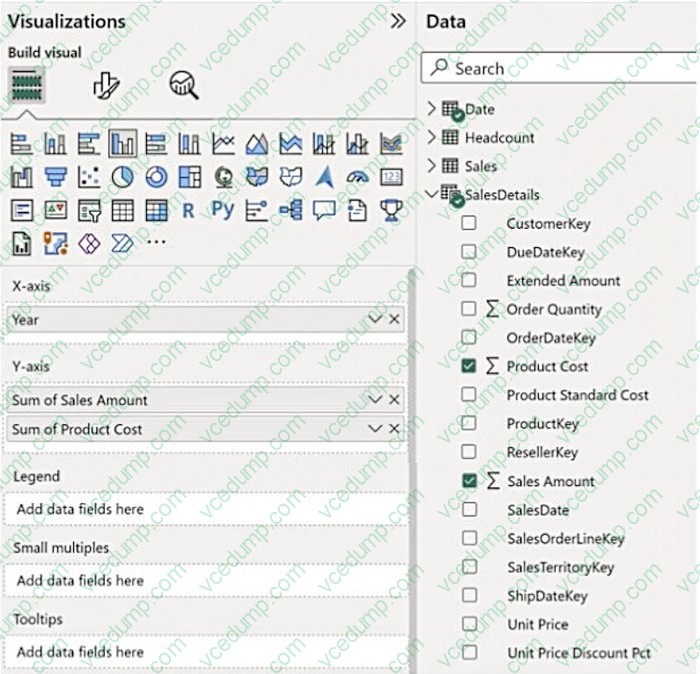
Use the drop-down menus to select the answer choice that completes each statement based on the information presented in the graphic.
NOTE: Each correct selection is worth one point.
-
Question 379:
Which two types of visualizations can be used in the balance sheet reports to meet the reporting goals? Each correct answer presents part of the solution.
NOTE: Each correct selection is worth one point.
A. a line chart that shows balances by quarter filtered to account categories that are long-term liabilities.
B. a clustered column chart that shows balances by date (x-axis) and account category (legend) without filters.
C. a clustered column chart that shows balances by quarter filtered to account categories that are long-term liabilities.
D. a pie chart that shows balances by account category without filters.
E. a ribbon chart that shows balances by quarter and accounts in the legend. -
Question 380:
You have a Power BI query named Expenses that imports the following data.
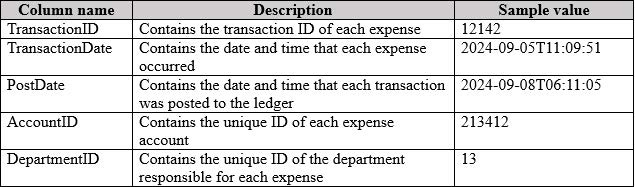
Users only use the date portion of the TransactionDate value when performing data analysis.
You need to minimize the model size without affecting the analysis.
Which two actions should you perform? (Choose two) Each correct answer presents part of the solution.
NOTE: Each correct selection is worth one point.
A. Change the data type of the TransactionDate column to Date.
B. Change the data type of the PostDate column to Date.
C. Remove the PostDate column.
D. Remove the TransactionID column.
Related Exams:
-
62-193
Technology Literacy for Educators -
70-243
Administering and Deploying System Center 2012 Configuration Manager -
70-355
Universal Windows Platform – App Data, Services, and Coding Patterns -
77-420
Excel 2013 -
77-427
Excel 2013 Expert Part One -
77-725
Word 2016 Core Document Creation, Collaboration and Communication -
77-726
Word 2016 Expert Creating Documents for Effective Communication -
77-727
Excel 2016 Core Data Analysis, Manipulation, and Presentation -
77-728
Excel 2016 Expert: Interpreting Data for Insights -
77-731
Outlook 2016 Core Communication, Collaboration and Email Skills
Tips on How to Prepare for the Exams
Nowadays, the certification exams become more and more important and required by more and more enterprises when applying for a job. But how to prepare for the exam effectively? How to prepare for the exam in a short time with less efforts? How to get a ideal result and how to find the most reliable resources? Here on Vcedump.com, you will find all the answers. Vcedump.com provide not only Microsoft exam questions, answers and explanations but also complete assistance on your exam preparation and certification application. If you are confused on your PL-300 exam preparations and Microsoft certification application, do not hesitate to visit our Vcedump.com to find your solutions here.