CaseStudy
Topic 1, Performance Based Questions
Environment
You have been provisioned a dedicated environment for your assessment which includes the following: Workstation
- windows Server 2019
- All software/tools/etc to perform the required tasks
- Nutanix Documentation and whitepapers can be found in desktop\files\Documentation
- Note that the workstation is the system you are currently togged into
Nutanix Cluster
- There are three clusters provided. The connection information for the relevant cluster will be displayed to
the high of the question Please make sure you are working on the correct cluster for each item Please
ignore any licensing violations
- Cluster A is a 3-node cluster with Prism Central 2022.6 where most questions will be performed
- Cluster B is a one-node cluster and has one syslog item and one security item to perform
- Cluster D is a one-node duster with Prism Central 5.17 and has a security policy item to perform
Important Notes
- If the text is too small and hard to read, or you cannot see an of the GUI. you can increase/decrease the
zoom of the browser with CTRL + ,and CTRL + (the plus and minus keys)
You will be given 3 hours to complete the scenarios for Nutanix NCMMCI Once you click the start button below, you will be provided with:
- A Windows desktop A browser page with the scenarios and credentials (Desktop\instructions)
Notes for this exam delivery: The browser can be scaled lo Improve visibility and fit all the content on the screen.
- Copy and paste hot-keys will not work Use your mouse for copy and paste.
- The Notes and Feedback tabs for each scenario are to leave notes for yourself or feedback for
- Make sure you are performing tasks on the correct components.
- Changing security or network settings on the wrong component may result in a falling grade.
- Do not change credentials on an component unless you are instructed to.
- All necessary documentation is contained in the Desktop\Files\Documentation directory
Simulation
Task 12
An administrator needs to create a report named VMs_Power_State that lists the VMs in the cluster and their basic details including the power state for the last month.
No other entities should be included in the report.
The report should run monthly and should send an email [email protected] it runs.
Generate an instance of the report named VMs_Power_State as a CSV and save the zip file as Desktop
\Files\VMs_Power_state.zip
Note: Make sure the report and zip file are named correctly. The SMTP server will not be configured.
A. Answer: See the Explanation for step by step solution.
Show answer and explanation
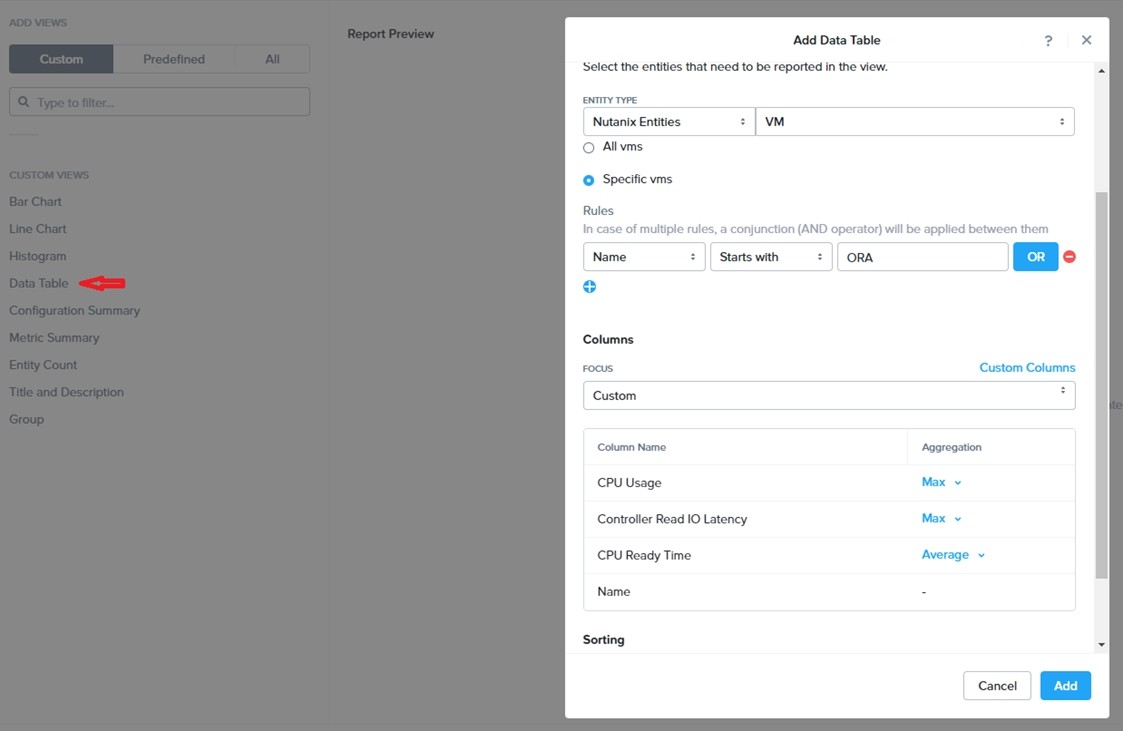
To create a report named VMs_Power_State that lists the VMs in the cluster and their basic details including the power state for the last month, you can follow these steps: Log in to Prism Central and click on Entities on the left menu. Select Virtual Machines from the drop-down menu and click on Create Report. Enter VMs_Power_State as the report name and a description if required. Click Next. Under the Custom Views section, select Data Table. Click Next. Under the Entity Type option, select VM. Click Next. Under the Custom Columns option, add the following variables: Name, Cluster Name, vCPUs, Memory, Power State. Click Next.
Under the Time Period option, select Last Month. Click Next. Under the Report Settings option, select Monthly from the Schedule drop-down menu. Enter [email protected] as the Email Recipient. Select CSV as the Report Output Format. Click Next.
Review the report details and click Finish.
To generate an instance of the report named VMs_Power_State as a CSV and save the zip file as Desktop
\Files\VMs_Power_state.zip, you can follow these steps: Log in to Prism Central and click on Operations on the left menu. Select Reports from the drop-down menu and find the VMs_Power_State report from the list. Click on Run Now.
Wait for the report to be generated and click on Download Report. Save the file as Desktop\Files
\VMs_Power_state.zip.
1. Open the Report section on Prism Central (Operations > Reports) 2. Click on the New Report button to
3. Under the Custom Views section, select Data Table 4. Provide a title to your custom report, as well as a description if required.
5. Under the Entity Type option, select VM 6. This report can include all as well as a selection of the VMs
7. Click on the Custom Columns option and add the below variables:
a.Name - Name of the listed Virtual Machine b.vCPUs - A combination of the vCores and vCPU's assigned to the Virtual Machine c.Memory - Amount of memory assigned to the Virtual Machine d.Disk Capacity - The total amount of assigned virtual disk capacity e.Disk Usage - The total used virtual disk capacity f.Snapshot Usage - The total amount of capacity used by snapshots (Excluding Protection Domain snapshots) 8. Under the Aggregation option for Memory and Disk Usage accept the default Average option
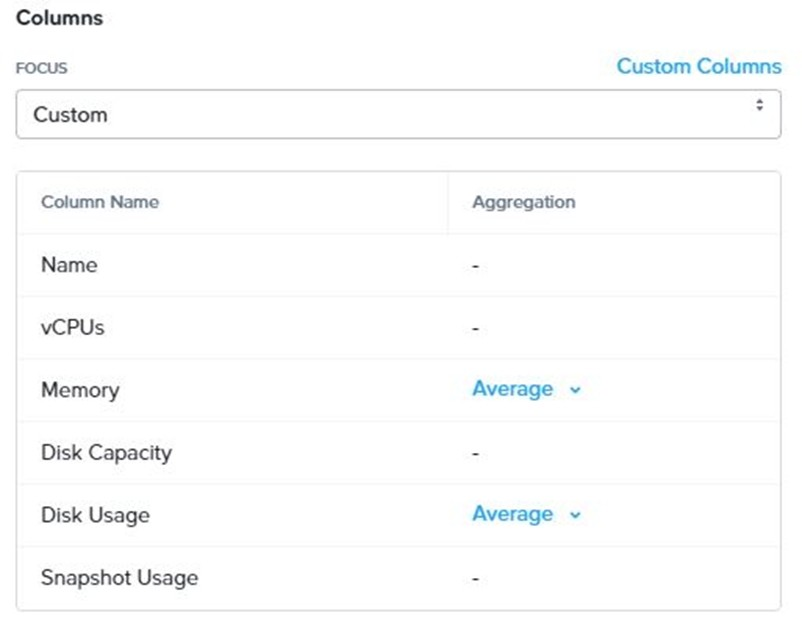
9. Click on the Add button to add this custom selection to your report 10. Next click on the Save and Run
Now button on the bottom right of the screen 11.Provide the relevant details on this screen for your custom report:
12. You can leave the Time Period For Report variable at the default of Last 24 Hours 13. Specify a report output of preference (PDF or CSV) and if required Additional Recipients for this report to be mailed to. The report can also simply be downloaded after this creation and initial run if required
14. Below is an example of this report in a CSV format: