Simulation
You are compiling data about courses at Bellows College.
On the ''Last Semester'' worksheet configure A3:F3 to automatically wrap the text.
Show answer and explanation
Click wrap text.
MO-200 Real Exam Questions
35 questions available · Page 1 of 4
Updated Exam DumpsVerified AnswersPass Guarantee
Simulation
You are compiling data about courses at Bellows College.
On the ''Last Semester'' worksheet configure A3:F3 to automatically wrap the text.
Click wrap text.
Simulation
On the ''Region 1'' worksheet, perform a multi-level sort, Sort table data by ''Product'' (A to Z) and then by ''Total Sales'' (Largest to Smallest).
Click sort and filter. Press custom sort and add levels to sort by.
Testlet 1
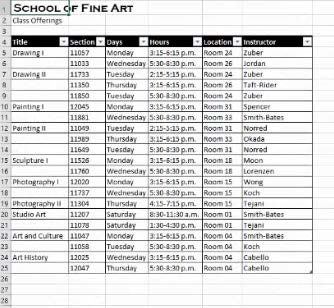
Topic 3, Class ScheduleCase Study
Simulation
On the 'Enrolment Summary'' worksheet, name the range A3:B7 ''Enrollment''
Select the range and type the name
Simulation
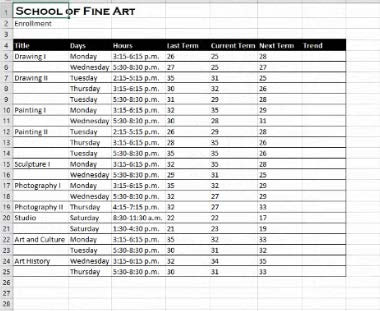
On the ''Enrollment'' worksheet, in cells G5:G25, insert Column sparkliness to compare the last, current, and next term values for each class period.
Select a blank cell and press insert. Pick column sparklines. Select the data range. Click and drag the bottom right corner for more.
Simulation
On the ''Projections' worksheet, in the ''Quarter2'' column, enter a formula that multiples the value in the Quarter 1'' column by the 'Q2_increase' named range. Use the range name in the formula instead of a cell reference or value.
[Send us your Suggestion on it.]
Simulation
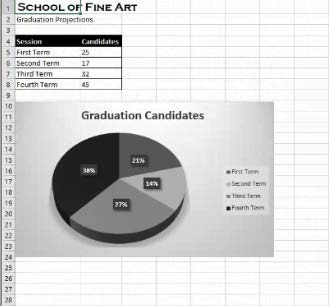
From the ''Graduation'' worksheet. Move the chart to a new chart sheet named ''Graduation Chart.''
Right click on the chart. Click move chart. Click new sheet and rename it.
Simulation
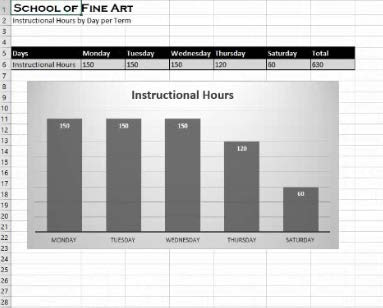
On the ''Instructional Hours'' worksheet, adjust the width of columns B,G to exactly 12.
Home tab, cells group, click format. Click column width.
Simulation
On the ''New Policies'' worksheet, change the elements displayed on the chart by changing the chart layout to Layout 3.
Click chart and press "chart design" click style 3.
Simulation
On the ''Enrollment Summary'' worksheet, apply the Style 7 chart and the Monochromatic Palette 6 color to
the chart.
Click and press chart design. Press chart 7. Click change colors.
Simulation
On the ''New Policies'' worksheet, add a Total Row to the table. Configure the Total Row to display the number of new policies for each month and for the 6-month total.
Click design and press total row. Click and drag.