DP-600 Real Exam Questions

Implementing Analytics Solutions Using Microsoft Fabric

248 questions available · Page 1 of 25

Updated Exam DumpsVerified AnswersPass Guarantee

Get Complete Exam Dumps
Question 1 Single choice

You have a Fabric tenant that contains a warehouse. The warehouse uses row-level security (RLS). You create a Direct Lake semantic model that uses the Delta tables and RLS of the warehouse.

When users interact with a report built from the model, which mode will be used by the DAX queries?

  1. A

    DirectQuery

  2. B

    Dual

  3. C

    Direct Lake

  4. D

    Import

Show answer and explanation

Correct answer: C

Question 2 Single choice

You have a Fabric tenant that contains a workspace named Workspace1. Workspace1 contains a single semantic model that has two Microsoft Power BI reports.

You have a Microsoft 365 subscription that contains a data loss prevention (DLP) policy named DLP1.

You need to apply DLP1 to the items in Workspace1.

What should you do?

  1. A

    Apply a master data endorsement to the semantic model.

  2. B

    Apply a certified endorsement to the semantic model.

  3. C

    Create a workspace identity.

  4. D

    Apply sensitivity labels to the semantic model and reports.

Show answer and explanation

Correct answer: D

Question 3 Single choice

Note: This question is part of a series of questions that present the same scenario. Each question in the series contains a unique solution that might meet the stated goals. Some question sets might have more than one correct solution, while others might not have a correct solution.

After you answer a question in this section, you will NOT be able to return to it. As a result, these questions will not appear in the review screen.

You have a Fabric tenant that contains a new semantic model in OneLake.

You use a Fabric notebook to read the data into a Spark DataFrame.

You need to evaluate the data to calculate the min, max, mean, and standard deviation values for all the string and numeric columns.

Solution: You use the following PySpark expression:

df.show()

Does this meet the goal?
  1. A

    Yes

  2. B

    No

Show answer and explanation

Correct answer: B

Explanation

The df.show() method also does not meet the goal. It is used to show the contents of the DataFrame, not to compute statistical functions.
References:
The usage of the show() function is documented in the PySpark API documentation.

Question 4 Single choice

A data model contains a fact table with order rows and a product dimension. You need a report slicer that filters orders by product category. What should you configure?

  1. A

    A relationship between the product dimension and the order fact table.

  2. B

    A separate report for every product category.

  3. C

    A calculated column that stores a screenshot of the slicer.

  4. D

    A workspace role named Product Category.

Show answer and explanation

Correct answer: A

Explanation

A relationship between the product dimension and the order fact table is needed so product category can filter order rows. The product dimension stores attributes such as category and product name, while the fact table stores individual order events and measures. When the relationship connects the two tables, a slicer using product category can filter the related facts and produce the intended order totals.

Creating a separate report for every product category duplicates report design and does not provide flexible filtering. A calculated column containing a screenshot has no analytical relationship to the data. A workspace role named Product Category would describe permissions or membership, not model filter behavior. Slicers operate through fields, relationships, and filter context in the model. The dimension-to-fact relationship is therefore the structural requirement that lets the category selection affect the order data correctly.

That structure also avoids hard-coding category logic in individual visuals, so the same product slicer can be reused across pages and reports consistently.

Question 5 Multiple choice

You need to provide Power Bl developers with access to the pipeline. The solution must meet the following requirements:

1. Ensure that the developers can deploy items to the workspaces for Development and Test.
2. Prevent the developers from deploying items to the workspace for Production.
3. Follow the principle of least privilege.

Which three levels of access should you assign to the developers? Each correct answer presents part of the solution. NOTE: Each correct answer is worth one point.

  1. A

    Build permission to the production semantic models

  2. B

    Admin access to the deployment pipeline

  3. C

    Viewer access to the Development and Test workspaces

  4. D

    Viewer access to the Production workspace

  5. E

    Contributor access to the Development and Test workspaces

  6. F

    Contributor access to the Production workspace

Show answer and explanation

Correct answers: B, D, E

Explanation

To meet the requirements, developers should have Admin access to the deployment pipeline (B), Contributor access to the Development and Test workspaces (E), and Viewer access to the Production workspace (D). This setup ensures they can perform necessary actions in development and test environments without having the ability to affect production.
References:
The Power BI documentation on workspace access levels and deployment pipelines provides guidelines on assigning appropriate permissions.

Question 6 Single choice

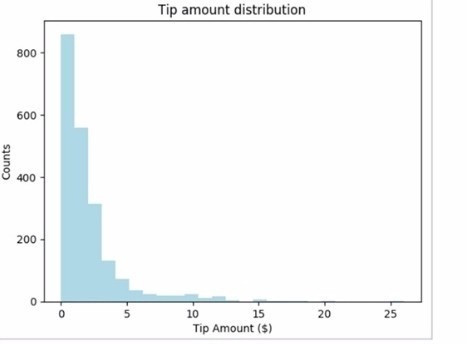
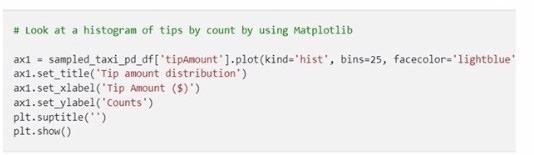
You have a Fabric notebook that has the Python code and output shown in the following exhibit.

Which type of analytics are you performing?

  1. A

    predictive

  2. B

    descriptive

  3. C

    prescriptive

  4. D

    diagnostic

Show answer and explanation

Correct answer: B

Explanation

The Python code and output shown in the exhibit display a histogram, which is a representation of the distribution of data. This kind of analysis is descriptive analytics, which is used to describe or summarize the features of a dataset.
Descriptive analytics answers the question of "what has happened" by providing insight into past data through tools such as mean, median, mode, standard deviation, and graphical representations like histograms.
References:
Descriptive analytics and the use of histograms as a way to visualize data distribution are basic concepts in data analysis, often covered in introductory analytics and Python programming resources.

Question 7 Single choice

A semantic model must restrict each regional manager to data for the manager's region. Which security feature should you implement?

  1. A

    Row-level security

  2. B

    A report page tooltip

  3. C

    A visual color theme

  4. D

    A data category

Show answer and explanation

Correct answer: A

Explanation

Row-level security is the feature that restricts data rows for different users or roles in a semantic model. For regional managers, the model can apply a region filter so each manager sees only the rows associated with the manager's assigned region. The same report and model can then serve many managers while enforcing different data visibility for each audience.

A report page tooltip provides additional information during report interaction, but it does not prevent a user from seeing rows. A visual color theme controls appearance and has no security effect. A data category can help classify a field for behavior such as geographic mapping, but it does not implement access restrictions. The requirement is about protecting data by region at query time, so row-level security is the model feature that matches the need and keeps the restriction close to the governed analytical layer.

Placing this rule in the model is also stronger than relying on report design alone, because the restriction follows the data whenever the governed model is queried.

Question 8 Hotspot

HOTSPOT

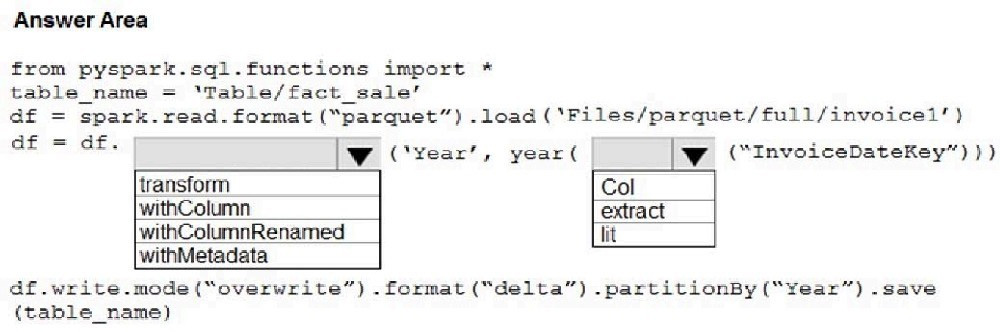
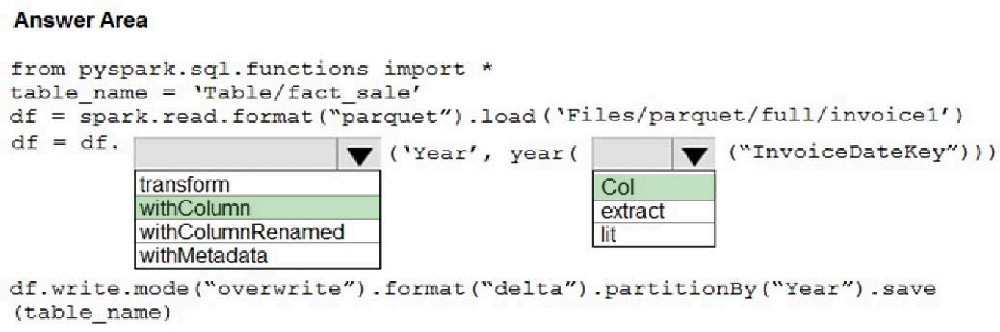
You have a Fabric tenant that contains a lakehouse named LH1 and a notebook. You have a Parquet file named invoice1 that contains a column named InvoiceDateKey of the timestamp data type.

You need to create a PySpark script that will import invoice1 and create a table named fact_sale in LH1.
The solution must meet the following requirements:

1. A new column named Year must be added to fact_sale.
2. The values in Year must use the InvoiceDateKey column.

How should you complete the script? To answer, select the appropriate options in the answer area.

NOTE: Each correct selection is worth one point.

Question diagram
Show answer and explanation
Correct answer diagram
Question 9 Single choice

You have a Fabric workspace named Workspace1 that contains the following items:

A warehouse named Warehouse1
A semantic model named Model1
An interactive report named Report1

You need to allow a user named User1 to access a single table in Warehouse1. The solution must follow the principle of least privilege.

What should you do first?

  1. A

    Assign object level permissions to User1 for Warehouse1.

  2. B

    Assign the db_datareader role to User1 for Warehouse1.

  3. C

    Share Warehouse1 with User1.

  4. D

    Assign the Viewer role to User1 for Workspace1.

Show answer and explanation

Correct answer: A

Question 10 Multiple choice

You are planning an analytics solution that must support source control for report and model definitions. Which two practices support this goal? Choose two.

  1. A

    Keep editable analytics definitions in a version-controlled repository.

  2. B

    Make all changes directly in production without review.

  3. C

    Use separate environments for development and production changes.

  4. D

    Store only rendered screenshots in version control.

  5. E

    Disable workspace governance to speed up deployment.

Show answer and explanation

Correct answers: A, C

Explanation

Source control for analytics definitions requires the editable model and report files to be stored in a version-controlled repository. That gives the team a history of changes, supports comparison between versions, and allows rollback when a change introduces a problem. Separate development and production environments complement the repository because work can be built and reviewed before it affects business users.

Direct edits in production bypass review and make it harder to understand what changed when a report or model behaves differently. Rendered screenshots do not preserve relationships, measures, report definitions, or data model metadata in a useful source-controlled form. Disabling workspace governance might reduce friction temporarily, but it removes the controls that make a multi-person analytics lifecycle reliable. The stronger practice is to keep definitions under version control and use environment separation to promote validated work into production deliberately.

It also supports collaboration: reviewers can examine the definition changes themselves, not just the final rendered output, before approving a release.