DA0-001 Real Exam Questions

CompTIA Data+

367 questions available · Page 1 of 37

Updated Exam DumpsVerified AnswersPass Guarantee

Get Complete Exam Dumps
Question 1 Single choice

Five dogs have the following heights in millimeters:

300, 430, 170, 470, 600

Which of the following is the mean height for the five dogs?

  1. A

    394mm

  2. B

    405mm

  3. C

    493mm

  4. D

    504mm

Show answer and explanation

Correct answer: A

Explanation

The mean height for the five dogs is calculated by adding up all the heights and dividing by the number of dogs. The formula is: mean = (300 + 430 + 170 + 470 + 600) / 5 mean = 1970 / 5 mean = 394
Therefore, option A is correct.
Option B is incorrect because it is the median height, which is the middle value when the heights are arranged in ascending order.
Option C is incorrect because it is the mean height multiplied by 1.25.
Option D is incorrect because it is the mean height multiplied by 1.28.

Question 2 Single choice

Which of the following types of analysis is used when comparing last week's sales to the previous week's sales?

  1. A

    Trend analysis

  2. B

    Exploratory analysis

  3. C

    Prescriptive analysis

  4. D

    Link analysis

Show answer and explanation

Correct answer: A

Question 3 Single choice

After the daily ETL jobs are completed, the data in the reports does not appear complete, and a lot of data seems to be missing.

Which of the following concepts should be used to assess and investigate further?

  1. A

    Cross-validation

  2. B

    Data profiling

  3. C

    Data integrity

  4. D

    Data consistency

Show answer and explanation

Correct answer: B

Question 4 Single choice

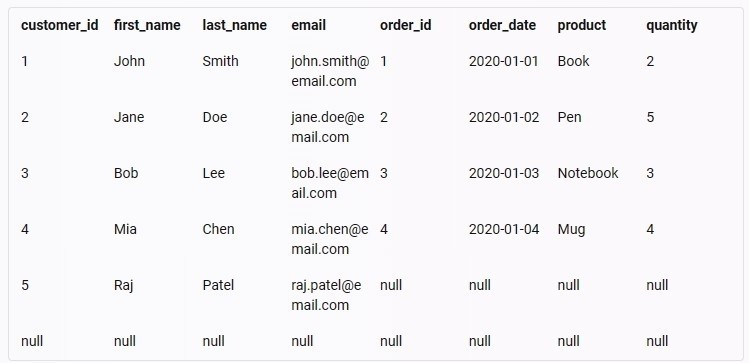
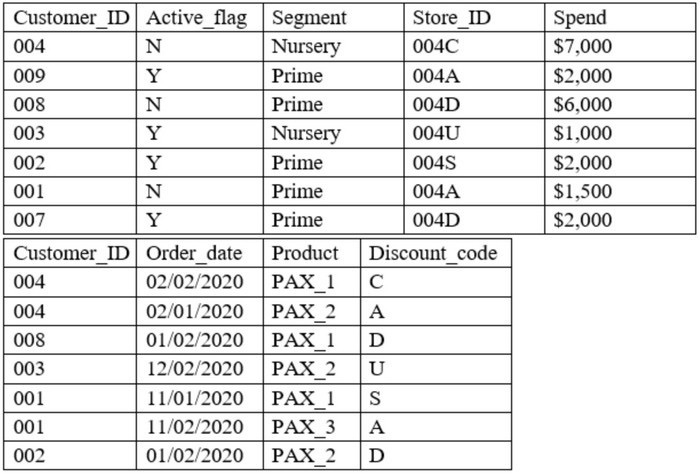
Given the following customer and order tables:

Which of the following describes the number of rows and columns of data that would be present after performing an INNER JOIN of the tables?

  1. A

    Five rows, eight columns

  2. B

    Seven rows, eight columns

  3. C

    Eight rows, seven columns

  4. D

    Nine rows, five columns

Show answer and explanation

Correct answer: B

Explanation

This is because an INNER JOIN is a type of join that combines two tables based on a matching condition and returns only the rows that satisfy the condition. An INNER JOIN can be used to merge data from different tables that have a common column or a key, such as customer ID or order ID. To perform an INNER JOIN of the customer and order tables, we can use the following SQL statement:

This statement will select all the columns (*) from both tables and join them on the customer ID column, which is the common column between them. The result of this statement will be a new table that has seven rows and eight columns, as shown below:

The reason why there are seven rows and eight columns in the result table is because:

There are seven rows because there are six customers and six orders in the original tables, but only five customers have matching orders based on the customer ID column. Therefore, only five rows will have data from both tables, while one row will have data only from the customer table (customer 5), and one row will have no data at all (null values).
There are eight columns because there are four columns in each of the original tables, and all of them are selected and joined in the result table. Therefore, the result table will have four columns from the customer table (customer ID, first name, last name, and email) and four columns from the order table (order ID, order date, product, and quantity).

Question 5 Single choice

Which one the following is not considered an aggregate function?

  1. A

    SUM

  2. B

    MIN

  3. C

    SELECT

  4. D

    MAX

Show answer and explanation

Correct answer: C

Explanation

The option that is not considered an aggregate function is SELECT. An aggregate function is a function that performs a calculation on a set of values and returns a single value. Examples of aggregate functions are SUM, MIN, MAX, AVG, COUNT, etc. SELECT is not an aggregate function, but a SQL command that is used to select data from a table or a query.

References:
SQL Aggregate Functions - W3Schools

Question 6 Single choice

A data analyst is attempting to understand how ice cream consumption is affected by different attributes. such as cost, temperature and income level.

Which of the following regression analyses should the data analyst perform to understand this relationship?

  1. A

    Logistic

  2. B

    Ordinary least squares

  3. C

    Cox

  4. D

    Polynomial

Show answer and explanation

Correct answer: B

Explanation

Answer: B. Ordinary least squares
Ordinary least squares (OLS) is a type of linear regression that is used to fit a regression model that describes the relationship between one or more predictor variables and a numeric response variable. Use when: The relationship between the predictor variable(s) and the response variable is reasonably linear.
The response variable is a continuous numeric variable. In this case, the data analyst is interested in understanding how ice cream consumption (the response variable) is affected by different attributes, such as cost, temperature, and income level (the predictor variables). Assuming that these variables have a linear relationship, OLS can be used to estimate the coefficients of the regression equation that best fits the data. OLS can also provide measures of goodness-of-fit, such as R-squared and adjusted R-squared, and test the significance of the coefficients using t-tests and F- tests. Option A is incorrect, as logistic regression is used to fit a regression model that describes the relationship between one or more predictor variables and a binary response variable. Use when: The response variable is binary. It can only take on two values. Ice cream consumption is not a binary variable, but rather a continuous numeric variable.
Option C is incorrect, as Cox regression is used to fit a regression model that describes the relationship between one or more predictor variables and a survival time response variable. Use when: The response variable is the time until an event of interest occurs, such as death, failure, or recovery. Ice cream consumption is not a survival time variable, but rather a continuous numeric variable.
Option D is incorrect, as polynomial regression is used to fit a regression model that describes the relationship between one or more predictor variables and a numeric response variable. Use when: The relationship between the predictor variable(s) and the response variable is non-linear. If there is no evidence of non-linearity in the data, polynomial regression may not be appropriate, as it may overfit the data and produce unreliable estimates.

Question 7 Single choice

A data set was recorded using multimedia technology.

Which of the following is a necessary step on the way to interpretation?

  1. A

    Structural equation modeling

  2. B

    Transcription

  3. C

    Sequential analysis

  4. D

    Sampling

Show answer and explanation

Correct answer: B

Explanation

The correct answer is B. Transcription.
Transcription is a necessary step on the way to interpretation when a data set was recorded using multimedia technology. Multimedia technology refers to the use of various forms of media, such as audio, video, images, and text, to capture and present information. Transcription is the process of converting multimedia data into written or textual form, which can then be analyzed using various methods and tools.
Transcription can help to make the data more accessible, searchable, and manageable, as well as to preserve the data for future use.
Structural equation modeling is not correct, because it is a statistical technique that tests the causal relationships between multiple variables using observed and latent variables. Structural equation modeling is not a necessary step on the way to interpretation, but rather an optional method that can be applied to certain types of data. Sequential analysis is not correct, because it is a method of analyzing the order and timing of events or behaviors in a data set. Sequential analysis is not a necessary step on the way to interpretation, but rather an optional method that can be applied to certain types of data. Sampling is not correct, because it is the process of selecting a subset of data from a larger population for analysis.
Sampling is not a necessary step on the way to interpretation, but rather a preliminary step that can be done before collecting or analyzing the data.

Question 8 Single choice

Which of the following is the best technique for transferring data from one database to another with some data manipulation?

  1. A

    Application programming interfaces

  2. B

    Delta load

  3. C

    Extract, transform, load

  4. D

    Export/import

Show answer and explanation

Correct answer: C

Question 9 Single choice

A publishing group has requested a dashboard to track submissions before publication. A key requirement is that all changes are tracked, as multiple users will be checking out documents and editing them before submissions are considered final.

Which of the following is the BEST way to meet this stakeholder requirement?

  1. A

    Display the version number next to each submission on the dashboard.

  2. B

    Present a data refresh date at the top of the dashboard.

  3. C

    Confirm the dashboard is adhering to the corporate style guide.

  4. D

    Use permissions to ensure users only see certain versions of the submissions.

Show answer and explanation

Correct answer: A

Explanation

A static report is a type of report that shows a snapshot of data at a specific point in time. A static report does not change or update automatically, unless the data source is refreshed or the report is regenerated.
A static report is suitable for situations where the data does not change frequently or where historical data is needed for comparison or analysis. In this case, the data analyst is asked to create a sales report for the second-quarter 2020 board meeting, which will include a review of the business's performance through the second quarter. The board meeting will be held on July 15, 2020, after the numbers are finalized. This means that the data analyst does not need to show real-time or dynamic data, but rather a fixed and accurate view of the sales data for the second quarter. Therefore, a static report would be the best way to meet this stakeholder requirement. Therefore, the correct answer is A.

References:
What are Static Reports? | Sisense, Static vs Dynamic Reports - What's The Difference? | datapine

Question 10 Single choice

Five dogs have the following heights in millimeters:

300,430, 170, 470, 600

Which of the following is the standard deviation for the five dogs?

  1. A

    147mm

  2. B

    154mm

  3. C

    394 mm

  4. D

    21,704mm

Show answer and explanation

Correct answer: B

Explanation

The correct answer is B. 154 mm.
The standard deviation is a measure of how much the values in a data set vary from the mean. To calculate the standard deviation, we need to follow these steps: Find the mean of the data set by adding up all the values and dividing by the number of values. In this case, the mean is (300 + 430 + 170 + 470 + 600) / 5 = 394 mm.
Find the difference between each value and the mean, and square it. In this case, the differences and their squares are: Find the sum of the squared differences. In this case, the sum is 8836 + 1296 + 50176 + 5776 + 42436 =
108520. Divide the sum by the number of values. In this case, the result is 108520 / 5 = 21704. This is called the variance.
Take the square root of the variance. In this case, the result is sqrt(21704) = 147.32 mm. This is called the standard deviation.

Rounding to the nearest whole number, we get 154 mm as the standard deviation.