E20-026 Exam Details
-
Exam Code
:E20-026 -
Exam Name
:Enterprise Storage Networking Specialist Exam -
Certification
:EMC Certifications -
Vendor
:EMC -
Total Questions
:163 Q&As -
Last Updated
:Jan 11, 2026
EMC E20-026 Online Questions & Answers
-
Question 1:
Refer to the exhibit.
Click on the calculator icon in the upper left corner. You are going into a meeting where you know your manager will have a question on your dataset -- specifically relating to customers that are classified as renters with good credit status.
In order to prepare for the meeting, you create a rule: RENTER => GOOD CREDIT. What is the confidence of the rule?
A. 63%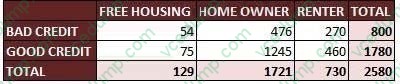
B. 41%
C. 18%
D. 73% -
Question 2:
Refer to the exhibit.
Click on the calculator icon in the upper left corner. An analyst is searching a corpus of documents for the topic "solid state disk". In the Exhibit, Table A provides the inverse document frequency for each term across the corpus. Table B
provides each term's frequency in four documents selected from corpus. Which of the four documents is most relevant to the analyst's search?
A. Document B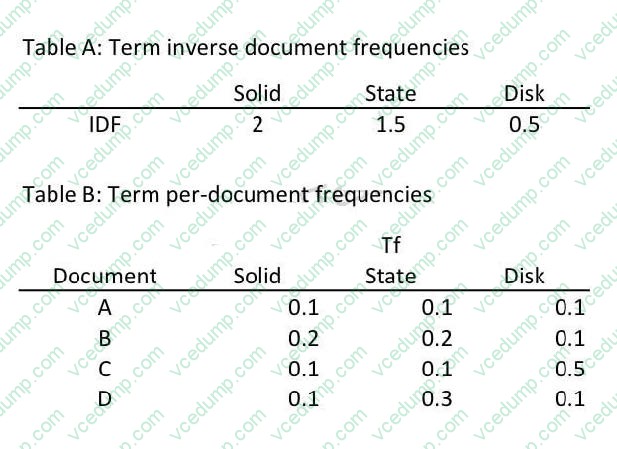
B. Document A
C. Document C
D. Document D -
Question 3:
Refer to the exhibit.
You have scored your Naive bayesian classifier model on a hold out test data for cross validation and determined the way the samples scored and tabulated them as shown in the exhibit. What are the the False Positive Rate (FPR) and the
False Negative Rate (FNR) of the model?
A. FPR = 15/262 FNR = 26/288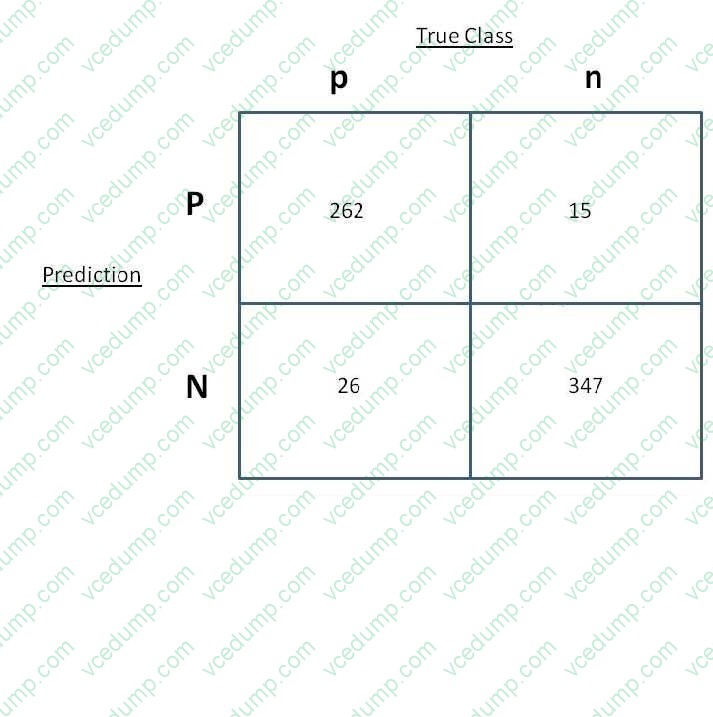
B. FPR = 26/288 FNR = 15/262
C. FPR = 262/15 FNR = 288/26
D. FPR = 288/26 FNR = 262/15 -
Question 4:
Which ROC curve represents a perfect model fit?
A. B.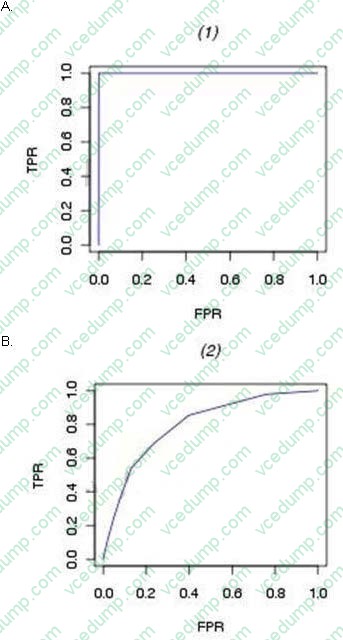
C. 52 / 55 -
Question 5:
Refer to the exhibit.
You have scored your Naive bayesian classifier model on a hold out test data for cross validation and determined the way the samples scored and tabluated them as shown in the exhibit.
What are the Precision and Recall rate of the model?
A. Precision = 262/277 Recall = 262/288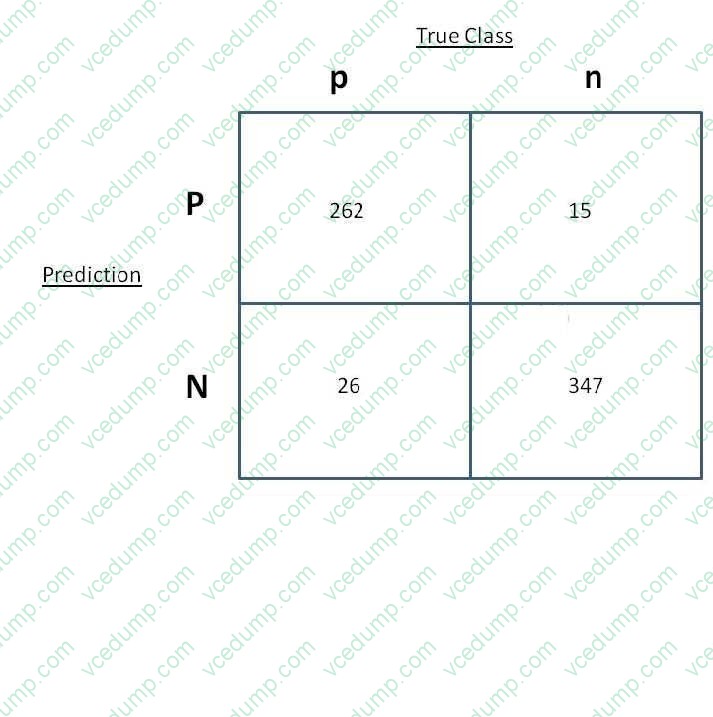
B. Precision =262/288 Recall = 262/277
C. Precision = 277/262 Recall = 288/262
D. Precision = 288/262 Recall = 277/262 -
Question 6:
Refer to the exhibit Consider the training data set shown in the exhibit. What are the classification (Y = 0 or 1) and the probability of the classification for the tuple X(1, 0, 0) using Naive Bayesian classifier?
A. Classification Y = 0,Probability = 4/54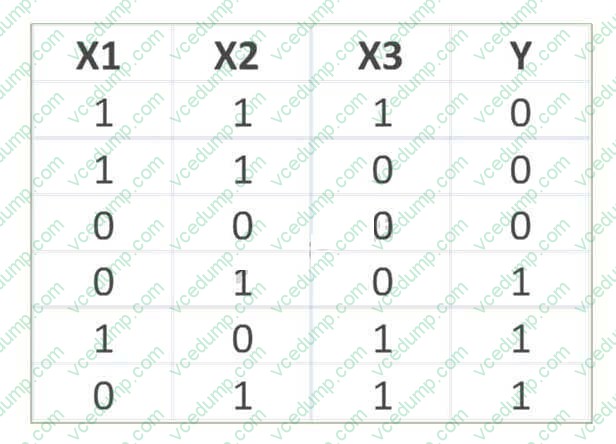
B. Classification Y = 1,Probability = 4/54
C. Classification Y = 0,Probability = 1/54
D. Classification Y = 1,Probability = 1/54 -
Question 7:
Refer to the exhibit.
The graph represents an ROC space with four classifiers labelled A through D. Which point in the graph represents a perfect classification?
A. S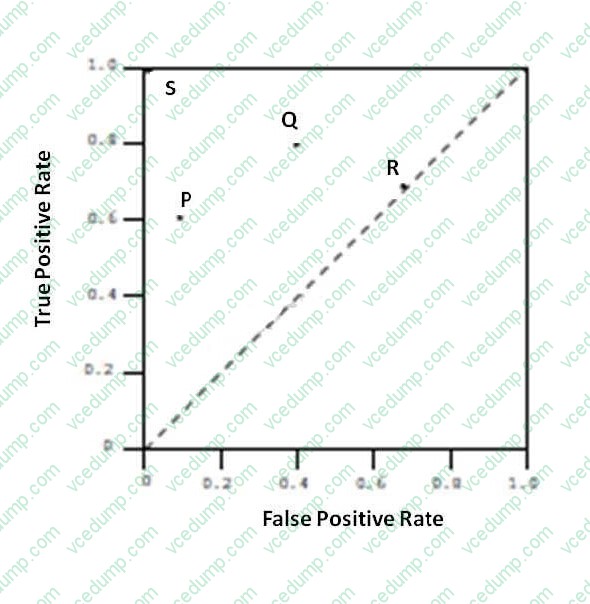
B. P
C. Q
D. R -
Question 8:
Refer to the exhibit.
You ran a linear regression, and the final output is seen in the exhibit. Based only on the information in the exhibit and an acceptable confidence level of 95%, how would you interpret the interaction of variable D with the dependent variable?
A. In this model,Variable D is not significantly interacting with the dependent variable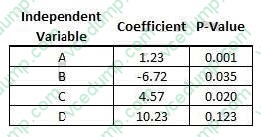
B. For every 1 unit increase in variable D,holding all other variables constant,we can expect the dependent variable to increase by 10.23 units
C. For every 1 unit increase in variable D,holding all other variables constant,we can expect the dependent variable to be multiplied by 10.23 units
D. Variable D is more significant than variables A,B,and C. -
Question 9:
Refer to the exhibit.
The exhibit shows four graphs labeled as Fig A thorough Fig D. Which figure represents the entropy function relative to a Boolean classification and is represented by the formula shown in Exhibit?
A. Fig-A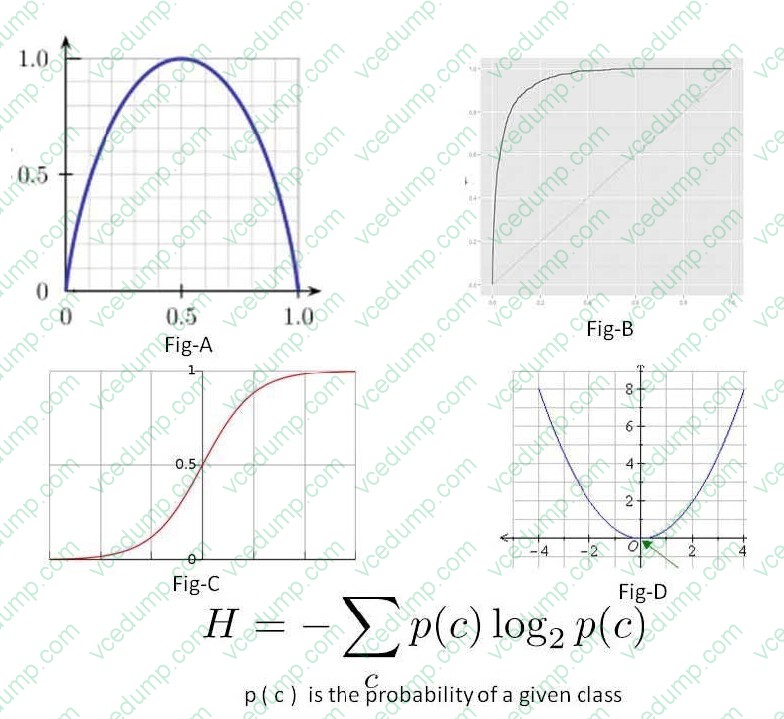
B. Fig-B
C. Fig-C
D. Fig-D -
Question 10:
Refer to the exhibit.
What provides the decision tree for predicting whether or not someone is a good or bad credit risk. What would be the assigned probability, p(good), of a single male with no known savings?
A. 0.83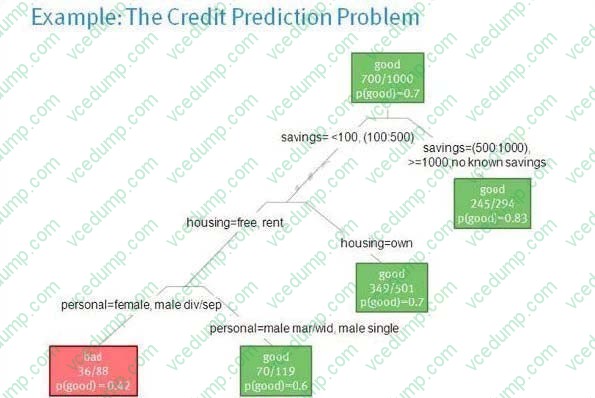
C. 0.498
D. 0.6
Related Exams:
-
D-CIS-FN-01
Dell Cloud Infrastructure and Services Foundations v2 -
D-ECS-DY-23
Dell ECS Deploy 2023 -
D-GAI-F-01
Dell GenAI Foundations Achievement -
D-ISM-FN-01
Dell Information Storage and Management Foundations v2 -
D-MSS-DS-23
Dell Midrange Storage Solutions Design 2023 -
D-OME-OE-A-24
Dell OpenManage Operate Achievement -
D-PCR-DY-01
Dell PowerProtect Cyber Recovery Deploy v2 -
D-PDD-DY-23
Dell PowerProtect DD Deploy 2023 -
D-PE-OE-23
Dell PowerEdge Operate 2023 -
D-PEXE-IN-A-00
Dell PowerEdge XE9680 and XE8640 Install
Tips on How to Prepare for the Exams
Nowadays, the certification exams become more and more important and required by more and more enterprises when applying for a job. But how to prepare for the exam effectively? How to prepare for the exam in a short time with less efforts? How to get a ideal result and how to find the most reliable resources? Here on Vcedump.com, you will find all the answers. Vcedump.com provide not only EMC exam questions, answers and explanations but also complete assistance on your exam preparation and certification application. If you are confused on your E20-026 exam preparations and EMC certification application, do not hesitate to visit our Vcedump.com to find your solutions here.