Exam Details
Exam Code
:E20-026Exam Name
:Enterprise Storage Networking Specialist ExamCertification
:EMC CertificationsVendor
:EMCTotal Questions
:163 Q&AsLast Updated
:Jul 09, 2025
EMC EMC Certifications E20-026 Questions & Answers
-
Question 21:
Refer to the Exhibit.
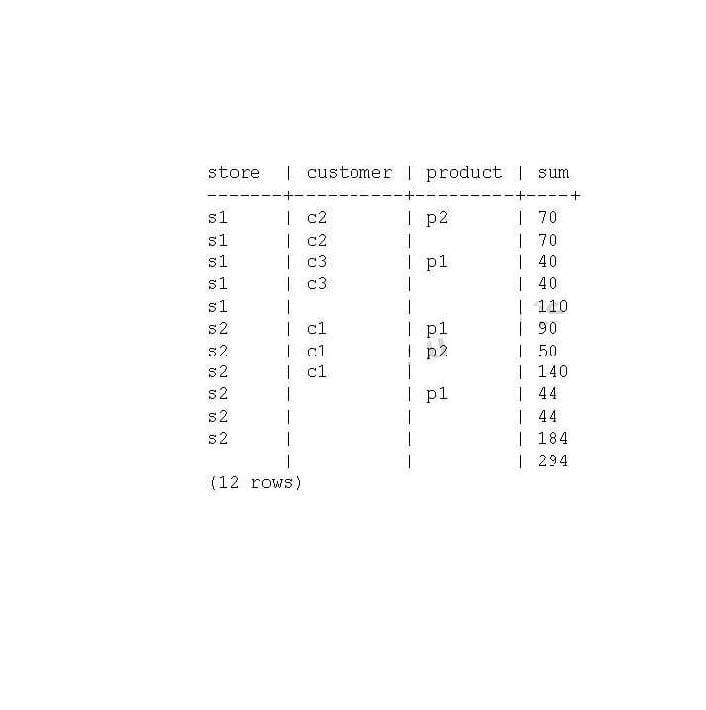
You are working on creating an OLAP query that outputs several rows of with summary rows of subtotals
and grand totals in addition to regular rows that may contain NULL as shown in the exhibit. Which function
can you use in your query to distinguish the row from a regular row to a subtotal row?
A. GROUPING
B. RANK
C. GROUP_ID
D. ROLLUP
-
Question 22:
Refer to the exhibit.
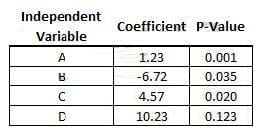
After analyzing a dataset, you report findings to your team:
1.
Variables A and C are significantly and positively impacting the dependent variable.
2.
Variable B is significantly and negatively impacting the dependent variable.
3.
Variable D is not significantly impacting the dependent variable. After seeing your findings, the majority of your team agreed that variable B should be positively impacting the dependent variable.
What is a possible reason the coefficient for variable B was negative and not positive?
A. Variable B is interacting with another variable due to correlated inputs
B. Variable B needs a quadratic transformation due to its relationship to the dependent variable
C. The information gain from variable B is already provided by another variable
D. Variable B needs a logarithmic transformation due to its relationship to the dependent variable
-
Question 23:
Refer to the exhibit.
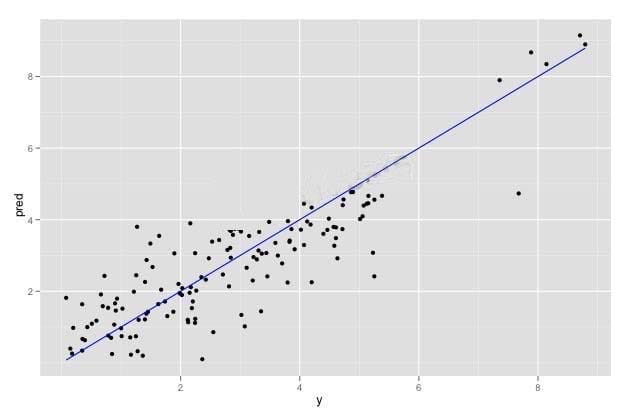
You have run a linear regression model against your data, and have plotted true outcome versus predicted
outcome. The R-squared of your model is 0.75. What is your assessment of the model?
A. The R-squared may be biased upwards by the extreme-valued outcomes. Remove them and refit to get a better idea of the model's quality over typical data.
B. The R-squared is good. The model should perform well.
C. The extreme-valued outliers may negatively affect the model's performance. Remove them to see if the R-squared improves over typical data.
D. The observations seem to come from two different populations,but this model fits them both equally well.
-
Question 24:
Refer to the exhibit.
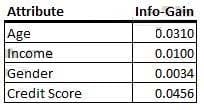
You are building a decision tree. In this exhibit, four variables are listed with their respective values of info-
gain.
Based on this information, on which attribute would you expect the next split to be in the decision tree?
A. Credit Score
B. Age
C. Income
D. Gender
-
Question 25:
Refer to the Exhibit.
In the Exhibit. For effective visualization, what is the chart's primary flaw?

A. The use of 3 dimensions.
B. The slanting of axis labels.
C. The location of the legend.
D. The order of the columns.
-
Question 26:
Refer to the exhibit.
You have plotted the distribution of savings account sizes for your bank. How would you proceed, based
on this distribution?
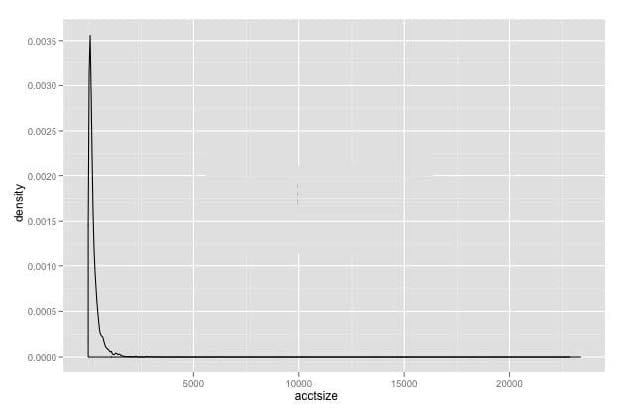
A. The data is extremely skewed. Replot the data on a logarithmic scale to get a better sense of it.
B. The data is extremely skewed,but looks bimodal; replot the data in the range 2,500-10,000 to be sure.
C. The accounts of size greater than 2500 are rare,and probably outliers. Eliminate them from your future analysis.
D. The data is extremely skewed. Split your analysis into two cohorts: accounts less than 2500,and accounts greater than 2500
-
Question 27:
Refer to the exhibit.
In the exhibit, a correlogram is provided based on an autocorrelation analysis of a sample dataset.
What can you conclude based only on this exhibit?
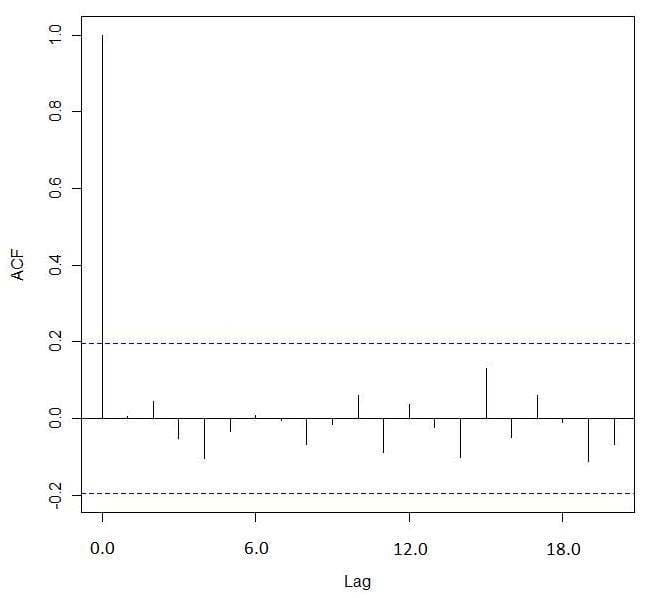
A. There appears to be no structure left to model in the data
B. There appears to be a seasonal component in the data
C. Lag 1 has a significant autocorrelation
D. There appears to be a cyclical component in the data
-
Question 28:
Refer to the exhibit. In the exhibit, the x-axis represents the derived probability of a borrower defaulting on a loan. Also in the exhibit, the pink represents borrowers that are known to have not defaulted on their loan, and the blue represents borrowers that are known to have defaulted on their loan. Which analytical method could produce the probabilities needed to build this exhibit?
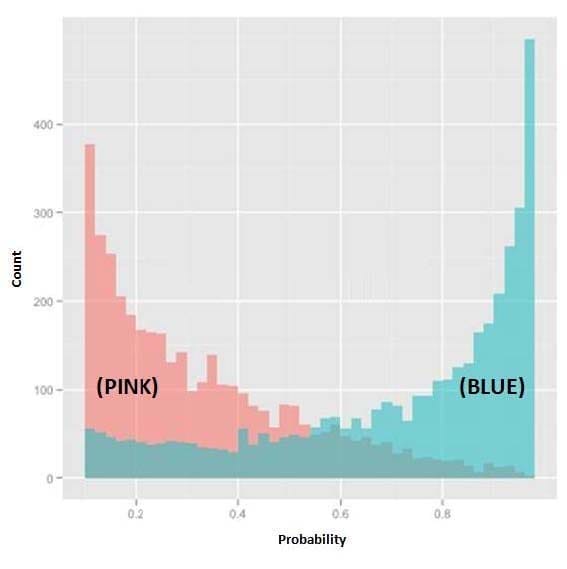
A. Logistic Regression
B. Linear Regression
C. Discriminant Analysis
D. Association Rules
-
Question 29:
Refer to the exhibit.
You have created a density plot of purchase amounts from a retail website as shown. What should you do
next?
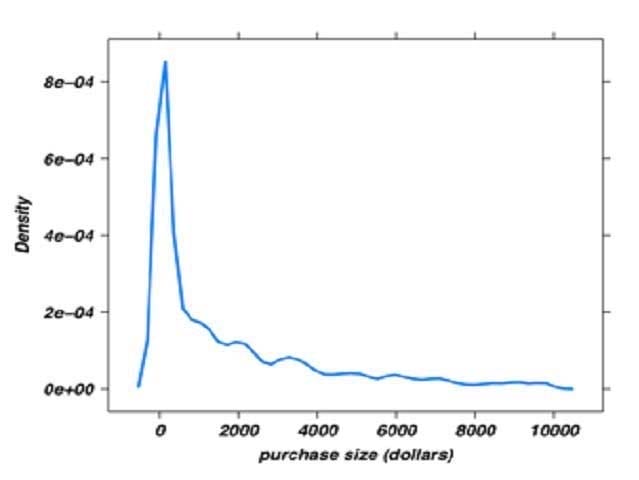
A. Recreate the plot using the barplot() function
B. Use the rug() function to add elements to the plot
C. Recreate the density plot using a log normal distribution of the purchase amount data
D. Reduce the sample size of the purchase amount data used to create the plot
-
Question 30:
Which word or phrase completes the statement?
Business Intelligence is to ad-hoc reporting and dashboards as Data Science is to ______________ .
A. Optimization and Predictive Modeling
B. Alerts and Queries
C. Structured Data and Data Sources
D. Sales and profit reporting
Related Exams:
D-GAI-F-01
Dell GenAI Foundations AchievementD-MSS-DS-23
Dell Midrange Storage Solutions Design 2023D-OME-OE-A-24
Dell OpenManage Operate AchievementD-PDD-DY-23
Dell PowerProtect DD Deploy 2023D-PE-OE-23
Dell PowerEdge Operate 2023D-PEXE-IN-A-00
Dell PowerEdge XE9680 and XE8640 InstallD-PSC-MN-01
Dell GenAI Foundations AchievementD-PST-MN-A-24
Dell PowerStore Maintenance AchievementD-PWF-DS-23
Dell PowerFlex Design 2023D-RP-DY-A-24
Dell RecoverPoint Deploy Achievement
Tips on How to Prepare for the Exams
Nowadays, the certification exams become more and more important and required by more and more enterprises when applying for a job. But how to prepare for the exam effectively? How to prepare for the exam in a short time with less efforts? How to get a ideal result and how to find the most reliable resources? Here on Vcedump.com, you will find all the answers. Vcedump.com provide not only EMC exam questions, answers and explanations but also complete assistance on your exam preparation and certification application. If you are confused on your E20-026 exam preparations and EMC certification application, do not hesitate to visit our Vcedump.com to find your solutions here.