QSBA2021 Exam Details
-
Exam Code
:QSBA2021 -
Exam Name
:Qlik Sense Business Analyst Certification - February 2021 Release -
Certification
:QlikView Certifications -
Vendor
:QlikView -
Total Questions
:50 Q&As -
Last Updated
:Jul 12, 2026
QlikView QSBA2021 Online Questions & Answers
-
Question 1:
Country USA US
S.A.
A business analyst needs to load several data files and notices that some of the values for the United States of America are formatted inconsistently.
What should the business analyst do?
A. Use data profiling to group the country values
B. Use data profiling and replace the country names
C. Use data profiling 10 hide the inconsistent country names
D. Use the filter and rename the country values -
Question 2:
A business analyst using a shared folder mapped to S \419379942\ receives an Excel We with more than 100 columns Many of the columns are duplicates. The current set of columns mat should be used have the suffix '_c* appended to the column name
What should the business analyst do to load the Excel data?
A. Open the Excel file, remove all columns that do not have the suffix '_c' and save t>e Me to be loaded
B. Deselect the fields that do NOT have the '_c' suffix in the data manager table preview
C. Utilize drier functionality in the data manager to select only columns with the suffix _C with a fitter condition
D. Load all columns because the recommended associations will use only columns with the suffix '_c* -
Question 3:
A business analyst s developing an app 10 track the influence of the company's mascot cat on instagram.
The marketing department has several requirements for this solution.
1.
Information must be updated every hour to the company's information monitor
2.
Data from Instagram must be fetched over a REST connection and combined with Google Analytics data
3.
There must be a way to visualize changes of followers *i a map Which two features are needed to meet these requirements? (Select two.)
A. Standard map visualization
B. Mashups
C. Qlik Sense Mobile offline
D. Qlik NPrinting
E. Qlik web connectors -
Question 4:
Refer to the exhibit.
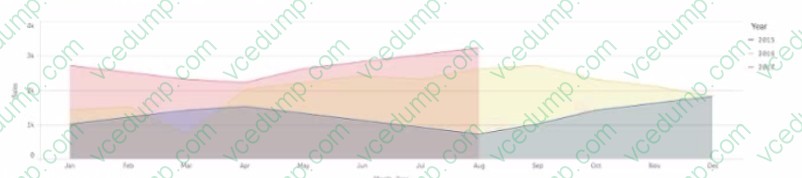
A CEO wants to use a similar visualization on the company's dashboards
The visualization must meet several requirements
1.
Show three years of sales data
2.
Display sales trends by month
3.
Allow comparison of years using an area style display
Which set of actions should a business analyst take to meet these requirements?
A. Add an area chart Add Month first then Year as the dimensions Add SumfSates) as the measure In the properties panel under Area select the dimension Year
B. Add a fine chart Add Month first then Year as the dimensions Add Surry Sales>; as the measure In the properties panel under Presentation select Area
C. Add a ,line chart Add a master drill-down dimension with Year and Month Add Sum(Sates) as the measure In the properties panel under Presentation, select Area
D. Add an area chart Add Year first then Month as the dimensions Add Sum(Sales) as the measure In the properties panel under Area select the dimensions -
Question 5:
A company CFO has requested an app that contains visualizations applicable to analyzing the finance data Each regional finance team will analyze their data, and the app must contain a high-level sheet that navigates to relevant detail sheets.
Which features support a logical design structure?
A. A Multi KPI set analysis
B. A pivot table that filters by region
C. A dashboard of KPIs and section access
D. A dashboard with regional bookmarks -
Question 6:
A business analyst creates an app for a large retailer The app is based on me past ^2 months of transactional data in CSV formal
After successfully demonstrating the app the retailer provides a tile that contains another seven years of data
After the new datais loaded the previously responsive app takes 10 times longer to respond to users' selections
The app has many complex expressions.
Which two actions should the business analyst take to resolve the issues?(Select two)
A. Request the data architect to create flagsin the data model to optimize set analysis expressions
B. Use JOIN statements to reduce the number of tables m the data model
C. Make sure a I master items contain variables that define the expressions
D. Replace set analysis with calculated fields in the data manager
E. Create versions of the app using a WHERE clause m the data manager to restrict the data -
Question 7:
A business analyst needs to uniquely identify tour sheets in the app overview Custom images have been created for each sheet What should the business analyst do next?
A. Use the media library to upload the mages
B. Add the images from the snapshot library
C. Open the assets panel to drag and drop the images
D. Drag and drop the images onto the sheet edit view -
Question 8:
Several departments use an app. The business analyst needs to modify access to the sheets so that each department can access their sheets only
What should me business analyst do?
A. Use the Stones feature to create a story with embedded sheets for each department
B. Edit the Show Condition expression field in the sheets tor each department
C. Choose to add a bookmark for each department
D. Create sheets with alternate states for each department -
Question 9:
Refer to the exhibit.
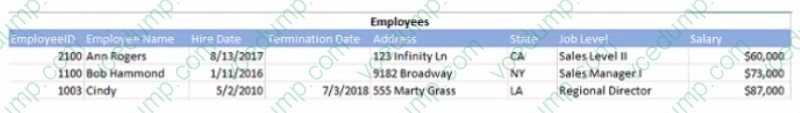
The data architect toads these fields from a data source A business analyst is creating an app for the human resources team Several visualizations are required
1.
Line chart to show the number of new hires and terminations monthly
2.
Treemap to show the number of employees by department and job level
3.
Distribution plot of annual salaries or amount of benefits received by duration of employment or location
4.
KPI to show average cost per employee The cost per employee can be calculated by adding the employee salary to the amount of benefits received Which two additional fields does the business analyst need from the data architect lo meet these requirements? (Select two )
A. Number of h res and termination
B. Benefits received
C. Average cost of employee
D. Years employed
E. Department -
Question 10:
A sales manager needs to visualize the company's sales. The sales manager needs to understand how sates and profitability are related over time.
The visualization will be used in a printed annual report.
The business analyst has access to the following data:
1.
Order Dates
2.
Order ID
3.
Total Safes by Order
4.
Net profit margin%
5.
Cost of Goods Sow (COGS)
Which visualization should the business analyst use?
A. Scatter Plot
B. Combo Chart
C. Distribution Plot
D. Line Chart
Related Exams:
-
QREP
Qlik Replicate Certification -
QSBA2021
Qlik Sense Business Analyst Certification - February 2021 Release -
QSBA2024
Qlik Sense Business Analyst Certification - 2024 -
QSDA2018
Qlik Sense Data Architect Certification - June 2018 Release -
QSDA2019
Qlik Sense Data Architect Certification - June 2019 Release -
QSDA2021
Qlik Sense Data Architect Certification - February 2021 Release -
QSDA2022
Qlik Sense Data Architect Certification - 2022 -
QSDA2024
Qlik Sense Data Architect Certification - 2024 -
QSSA2018
Qlik Sense System Administrator Certification - June 2018 Release -
QV_DEVELOPER_01
QlikView 11 Developer Certification
Tips on How to Prepare for the Exams
Nowadays, the certification exams become more and more important and required by more and more enterprises when applying for a job. But how to prepare for the exam effectively? How to prepare for the exam in a short time with less efforts? How to get a ideal result and how to find the most reliable resources? Here on Vcedump.com, you will find all the answers. Vcedump.com provide not only QlikView exam questions, answers and explanations but also complete assistance on your exam preparation and certification application. If you are confused on your QSBA2021 exam preparations and QlikView certification application, do not hesitate to visit our Vcedump.com to find your solutions here.