EINSTEIN-ANALYTICS-AND-DISCOVERY-CONSULTANT Exam Details
-
Exam Code
:EINSTEIN-ANALYTICS-AND-DISCOVERY-CONSULTANT -
Exam Name
:Salesforce Certified Einstein Analytics and Discovery Consultant -
Certification
:Salesforce Certifications -
Vendor
:Salesforce -
Total Questions
:209 Q&As -
Last Updated
:Feb 28, 2026
Salesforce EINSTEIN-ANALYTICS-AND-DISCOVERY-CONSULTANT Online Questions & Answers
-
Question 41:
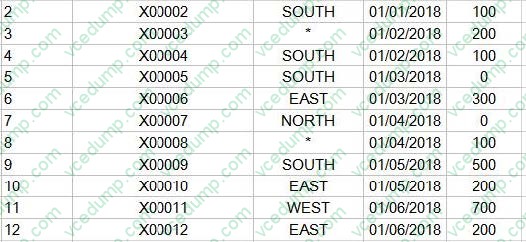
A shipping company created a dataset. "Bookll," containing budget per region per month for the first six months of 2018. The dataset is shown in the graphic. Now, they want to create a lens showing the total budget for each region for each month. Every combination of region and month must be shown in the lens, even if there is no data.
How can an Einstein Consultant help this company build this lens?
A. Use a SAQL query leveraging the "fill" statement with a "partition" parameter.
B. Use a SAQL query to create fake rows for any data that is missing data from the dataset.
C. Use a "Compare Table" and use the "Show summary" option.
D. Use a "Compare Table" and add a column leveraging the "Running Total" function. -
Question 42:
What can you do with the dataflow?
A. Extract data from an external CSV file into Analytics
B. Extract Salesforce object data into Analytics
C. Build a dashboard
D. Explore a dataset -
Question 43:
A client has two datasets that are used across seven different dashboards. Three of these dashboards are used by marketing and four are used by sales. The client requires that only marketing can access the marketing dashboards and only sales can access the sales dashboards.
What solution should be recommended?
A. Create two custom apps: one for marketing dashboards with marketing as "viewer" and one for sales dashboards with sales as "viewer." Add the datasets as references to both custom apps.
B. Create three custom apps: one for marketing dashboards with marketing as "viewer," one for sales dashboards with sales as "viewer," and one for datasets where marketing and sales are "viewer."
C. Create one custom app for the datasets and share it with marketing and sales as "viewer."
D. Duplicate the datasets and create two custom apps: one for marketing dashboards and datasets with marketing as "editor" and one for sales dashboards and datasets with sales as "editor." -
Question 44:
Max of objects that can be enabled for Data Sync
A. 200
B. 100
C. 150
D. 50 -
Question 45:
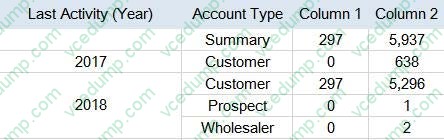
Universal Containers has a Sales Manager dashboard. They need to build a table as shown in the graphic and calculate the summary as the first line in a compare table. How can the summary be calculated'
A. Use the Show Summary option in the compare table.
B. Add a formula field to calculate the summary.
C. Use a SAQL query since the summary is not available in standard interface.
D. Create a computeExpression field in the Dataflow to calculate the summary. -
Question 46:
A consultant built an Einstein Analytics dashboard for a company. The company then requested an enhancement to the dashboard and provided additional data that needs to be displayed. As a result, the consultant decides to "augment" the dataflow.
Which phrase describes this transformation?
A. Add data based on the right-side grain
B. Join data similar to an SQL statement
C. Add data as a lookup relationship (left side is the lowest grain)
D. Join data based on a many-to-many relationship -
Question 47:
What happens if you first disable Analytics, and then you re-enable Analytics later? Select 2
A. User permissions are removed from each defined permission set if Analytics is disabled. (Missed)
B. User permissions are not removed from each defined permission set if Analytics is disabled.
C. You must define the permission sets again if Analytics is re-enabled. (Missed)
D. You must not define the permission sets again if Analytics is re-enabled. -
Question 48:
A company wants to create a timeline chart to visualize the evolution of their Closed Won Opportunities. What are the required parameters to build a lens that displays output similar to the image shown?
A. 2 measures, 0-2 groupings if trellis is disabled, or 0-4 groupings if trellis is enabled
B. 1 measure, 1-2 groupings if trellis is disabled, or 1-4 groupings if trellis is enabled
C. 1 measure, 1 grouping by a date field, and either 0-1 groupings by a dimension if trellis is disabled, or 0-2 groupings if trellis is enabled
D. 1 measure, 0 groupings if trellis is disabled, or 0-2 groupings if trellis is enabled -
Question 49:
How can you restrict access to Analytics data at the row level?
A. Manually add a flag to each row to prevent access.
B. Use a security predicate to filter which rows are returned.
C. Use subtle thought control.
D. Remove restricted rows from the JSON file. -
Question 50:
What are the two main parts of a lens/exploration?
A. Query
B. Visualization
C. Dataset
D. Measure
E. Grouping
Related Exams:
-
201-COMMERCIAL-BANKING-FUNCTIONAL
Salesforce enCino 201 Commercial Banking Functional -
ADM-201
Salesforce Certified Platform Administrator (Plat-Admn-201) -
ADM-211
Administration Essentials for Experienced Admin (ADM-211) -
ADM-261
Service Cloud Administration (SU24) -
ADVANCED-ADMINISTRATOR
Salesforce Certified Advanced Administrator -
ADVANCED-CROSS-CHANNEL
Marketing Cloud Advanced Cross Channel Accredited Professional -
ADX-201
Administrative Essentials for New Admins in Lightning Experience -
ADX-271
Salesforce Certified Community Cloud Consultant (ADX-271) -
AGENTFORCE-SPECIALIST
Salesforce Certified Agentforce Specialist (AI-201) -
ALS-CON-201
Salesforce Certified Agentforce Life Sciences Consultant
Tips on How to Prepare for the Exams
Nowadays, the certification exams become more and more important and required by more and more enterprises when applying for a job. But how to prepare for the exam effectively? How to prepare for the exam in a short time with less efforts? How to get a ideal result and how to find the most reliable resources? Here on Vcedump.com, you will find all the answers. Vcedump.com provide not only Salesforce exam questions, answers and explanations but also complete assistance on your exam preparation and certification application. If you are confused on your EINSTEIN-ANALYTICS-AND-DISCOVERY-CONSULTANT exam preparations and Salesforce certification application, do not hesitate to visit our Vcedump.com to find your solutions here.