Exam Details
Exam Code
:CBDAExam Name
:Certification in Business Data Analytics (CBDA)Certification
:IIBA CertificationsVendor
:IIBATotal Questions
:150 Q&AsLast Updated
:Jun 29, 2025
IIBA IIBA Certifications CBDA Questions & Answers
-
Question 141:
A call center has requested to review their sales conversion data for the month. The analyst working on this request is trying to identify the chart that will effectively present the data, which includes: the number of leads, the number of calls made, the number of calls completed, the number of customers interested and the number of sales. What chart should the analyst use to show the values across each stage of the pipeline?
A. Pie chart
B. Funnel chart
C. Bar chart
D. Bullet chart
-
Question 142:
The architecture team puts forth a solution architecture that integrates multiple data sources from within and outside the organization. The architecture provides the foundation to source a new analytics program. If one of the objectives of the analytics team was to provide 'one source of the truth', this objective would be referring to which of the following?
A. Identifying one key stakeholder, who can make final decisions about which sources to relate/merge
B. Evaluating the completeness, validity, and reliability of the data from source systems
C. Ensuring stakeholders always have clear insight into the final requirements at all times
D. Enforcing master data management principles and practices
-
Question 143:
A software company launched a new product in late 2016. The product manager is reviewing a Box and Whisker plot used to compare year-over-year sales, from 2017 to 2018. What is the conclusion he can make from this chart?
A. 2017 minimum and maximum sales are higher than 2018, and the 2017 median result is higher than the 2018 median result
B. 2017 minimum and maximum sales are higher than 2018, but the 2017 median result is lower than 2018 1st quartile result
C. 2018 minimum and maximum sales are higher than 2017, and the 2018 quartile results are higher than 2017 quartile results
D. 2018 minimum and maximum sales are higher than 2017, and the 2018 1st quartile is higher than 2017 median result
-
Question 144:
As the team discusses how to utilize the results of their data analysis to put forth a business recommendation, an analyst on the team voices concern over the current organizational culture presenting a roadblock to their ability to influence business decision making. Which of the following would be a justifiable concern at this stage of the team's efforts?
A. Difficulty bringing business stakeholders to a shared understanding about value when sharing data assets across business domains
B. Changing the mindsets of business stakeholders to trust insights gleaned from data over experience and intuition
C. Applying a myopic view of data and establishing data silos which create roadblocks to exploring available data sources
D. Finding data that creates value creating difficulties, as not all data helps a business make better decisions
-
Question 145:
An analytics team employed at a leading credit card company is utilizing data analytics to identify unusual credit card purchases.
They have created the following visual. How many extreme outliers exists in this dataset?
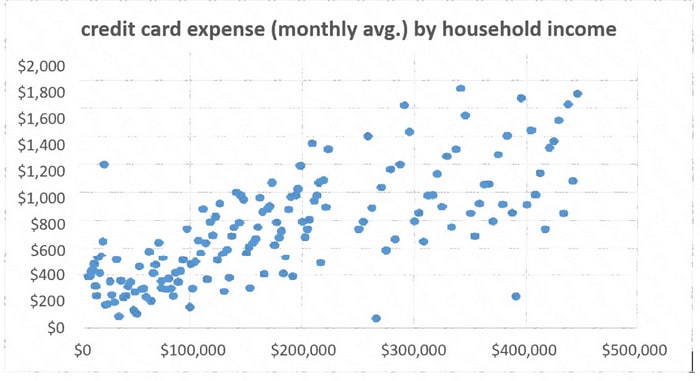
A. 0
B. 5
C. 3
D. 2
-
Question 146:
The analytics team has completed analyzing a dataset and unfortunately the data didn't deliver the kinds of insights that the team was hoping for. After much contemplation, they decide to:
A. Summarize the results and indicate the outcome was inconclusive
B. Inform management that analytics could not derive insightful results
C. Wait a few weeks and rerun the analysis using refreshed data
D. Restart the work with formation of a new research question
-
Question 147:
An analytics team has completed some initial data analysis but is considering revising their research question based on their analysis findings. The team was concerned the original question was too broad. What outcome would lead the team to have this concern?
A. Data once analyzed had significant data quality issues
B. Data the team had planned to use was not available
C. Difficult to identify the KPIs to measure
D. The source data sets could not be merged
-
Question 148:
A marketing director has asked the question 'How many product purchases are expected this coming year given the current marketing campaign?". What type of analytics would be performed to answer this question?
A. Descriptive
B. Predictive
C. Diagnostic
D. Prescriptive
-
Question 149:
Insights based on the data collected indicate that a multi-national company could increase its salesof a mature product by reducing its price by 20% which would result in increased revenues of 2% over a 6-month period. The team recommends this as an appropriate goal for its organization. This is considered a good goal because:
A. It meets all the criteria for a well-defined objective
B. The organization can derive additional revenue from the product
C. It indicates that the company does not have to incur costs associated with retiring this product
D. Management will be pleased that the mature product can still contribute to revenue
-
Question 150:
A real estate broker is tracking monthly sales between two of its teams. The results have been visualized using a Treemap chart. What is the advantage of using a Treemap chart, over a Sunburst chart to visualize the results?
A. With its colour scheme, it is easy to compare the variables within a Treemap
B. With its rectangles and straight lines, a Treemap is optimized to include more
C. A Treemap is meant to represent a hierarchical result set as opposed to a Sunburst chart
D. A Treemap shows all the hierarchical levels of data as opposed to a Sunburst chart
Tips on How to Prepare for the Exams
Nowadays, the certification exams become more and more important and required by more and more enterprises when applying for a job. But how to prepare for the exam effectively? How to prepare for the exam in a short time with less efforts? How to get a ideal result and how to find the most reliable resources? Here on Vcedump.com, you will find all the answers. Vcedump.com provide not only IIBA exam questions, answers and explanations but also complete assistance on your exam preparation and certification application. If you are confused on your CBDA exam preparations and IIBA certification application, do not hesitate to visit our Vcedump.com to find your solutions here.