Collaborative games are used by a business analyst to identify the research questions to be explored within an analytics system.
Participants are asked to write down a research question on a sticky note, put the notes on the wall,and move them towards related research questions. What type of Collaborative game is being played?
A. Affinity Map
B. Fishbowl
C. People polling
D. Product Box
Correct Answer: A
An affinity map is a collaborative game that helps participants to group similar ideas or features together. It is useful for identifying research questions that are related to each other and finding common themes or patterns. In this game, participants write down their research questions on sticky notes and place them on the wall. Then, they move the notes around to form clusters of related questions. The clusters can be labeled with a descriptive name or a question that summarizes the theme. An affinity map can help participants to prioritize the most important or relevant research questions and generate insights from the data. https://businessanalystmentor.com/collaborative-games-business-analysis/
Question 102:
An analyst at a supermarket chain has been asked to extract data from multiple data sources to complete a study on customer spending habits. The analyst is going to query data from various databases. Which statement is true about database querying?
A. Querying can be used to create predictive data models
B. Irrespective of the querying language used, data results retrieved are always in a tabular format
C. A querying language is independent of the type of database being used
D. Querying is a structured way of searching, manipulating and managing data
Correct Answer: D
Querying is a technique that allows analysts to access, filter, join, aggregate, and transform data from various databases using a specific syntax and logic1. Querying can be used for different purposes, such as data exploration, data preparation, data analysis, and data visualization2. Querying is not limited to creating predictive data models, nor does it always produce tabular results. Moreover, querying languages may vary depending on the type and structure of the database, such as relational, hierarchical, or document-based
Question 103:
A job satisfaction survey is being developed. Half of the employees will be asked the question "Do you enjoy working in your workplace?" The other half will be asked "Do you like the current work benefits?". The business analyst raises concern over the survey. What is concerning to the business analyst?
A. Precision
B. Reproducibility
C. Reliability
D. Validity
Correct Answer: D
The business analyst is concerned about the validity of the survey. Validity is the extent to which a survey measures what it intends to measure. In this case, the survey is supposed to measure job satisfaction, but the two questions asked to different groups of employees are not equivalent or relevant to this construct. The question "Do you enjoy working in your workplace?" is more directly related to job satisfaction than the question "Do you like the current work benefits?". The latter question may capture only one aspect of job satisfaction, and may not reflect the overall level of contentment or happiness with the job. Therefore, the survey results may not be valid or accurate in measuring job satisfaction
Question 104:
A business analyst constructs a model they would like to review with key business stakeholders but decides to review the model first with the data scientist who has performed the data analysis. The data scientist provides some suggestions on how to reduce the complexity in the model. One suggestion is to use color to group objects needing to be associated. The data scientist is encouraging using which Gestalt Principle of Perception with regards to data visualization?
A. Connection
B. Proximity
C. Similarity
D. Enclosure
Correct Answer: C
The data scientist is encouraging using the Gestalt Principle of Similarity with regards to data visualization. This principle states that the brain groups objects together that are similar in appearance, such as color, shape, size, or orientation. By using color to group objects needing to be associated, the data scientist is suggesting a way to reduce the complexity in the model and make it easier for the viewers to perceive the patterns and relationships among the data
Question 105:
Senior executives in a large organization receive numerous sales reports of every sale through a corporate dashboard on a weekly basis. The executives are considering budget increases for various functions but would like to know if they are obtaining good returns for current budget allocations. They ask the analytics team to research and answer: "How effective is our marketing spend?" This question is:
A. Already answered in the sales data
B. Difficult to analyze because its narrowly focused
C. Sufficient to begin initial analysis
D. Too broadly scoped to be effectively answered
Correct Answer: D
The question "How effective is our marketing spend?" is too broadly scoped to be effectively answered, because it is a vague and ambiguous question that does not specify the criteria, scope, or timeframe for measuring the effectiveness of the marketing spend. The question also does not define what constitutes marketing spend, or how it relates to the sales data or the budget allocations. The question needs to be refined and clarified to make it more focused, relevant, and feasible for the analytics team to answer. For example, the question could be rephrased as "How does the marketing spend per channel affect the sales revenue and customer retention rate in the last quarter?"
Question 106:
The interplay between enterprise systems and data analytics can be envisioned at various layers. The layer that connects the business processes to data analytics is the:
A. information layer
B. physical layer
C. technical layer
D. infrastructure layer
Correct Answer: A
The information layer is the layer that connects the business processes to data analytics. It consists of the data models, data quality, data governance, and data security that enable the data to be accessed, analyzed, and transformed into insights. The information layer also supports the communication and collaboration among the stakeholders involved in the data analytics process. The other layers are the physical layer, which deals with the hardware and software components of the data infrastructure; the technical layer, which handles the data integration, data storage, data processing, and data analysis techniques; and the infrastructure layer, which provides the network, cloud, and security services for the data environment
Question 107:
There were 7 students enrolled in the Introduction to Artificial Intelligence course. These were the student's scores from the final exam: 64, 70, 80, 80, 90, 98, 100
What is the mean and mode for the outlined scores?
A. 83.14, 80
B. 79.84, 81.40
C. 80,80
D. 80, 83.14
Correct Answer: A
The mean is the average of all the scores, which is found by adding them up and dividing by the number of scores. The mode is the most frequent score, which is the one that occurs the most times. To find the mean and mode for the outlined scores, we can use the following steps:
1.
Arrange the scores in ascending order: 64, 70, 80, 80, 90, 98, 100
2.
Add up the scores: 64 + 70 + 80 + 80 + 90 + 98 + 100 = 582
3.
Divide the sum by the number of scores: 582 / 7 = 83.14
4.
The mean is 83.14
5.
Count how many times each score occurs: 64 occurs once, 70 occurs once, 80 occurs twice, 90 occurs once, 98 occurs once, 100 occurs once
6.
The score that occurs the most times is 80
7.
The mode is 80
Therefore, the mean and mode for the outlined scores are 83.14 and 80, respectively12 References: 1: Mean, median, and mode review (article) | Khan Academy 2: Mean, Median, and Mode: Measures of Central TendencyStatistics By Jim
Question 108:
The results for a certification exam were revealed in percentage and percentile. The results for one of the attendees was: 75%, 90th percentile. What is the value in sharing the percentile score?
A. The percentile score provides value by assessing the attendee's score against the average score for that exam
B. While the exam score is an objective score, the percentile is a relative score that assesses the attendee's score against the highest possible score
C. By ranking, it provided additional insight on how the attendee performed in comparison to other attendees
D. The percentile score does not add any additional value in assessing the attendee's performance
Correct Answer: C
The percentile score provides value by ranking the attendee's score among all the scores of the exam takers. A percentile score of 90 means that the attendee scored higher than 90% of the exam takers, and only 10% scored higher than the attendee. This gives a relative measure of how the attendee performed in comparison to other attendees, and how competitive or exceptional the score is. The percentile score does not depend on the average or the highest possible score of the exam, but only on the distribution of the scores of the exam takers.
Question 109:
A real estate broker is tracking monthly sales between two of its teams. The results have been visualized. What insights can be drawn from the chart?
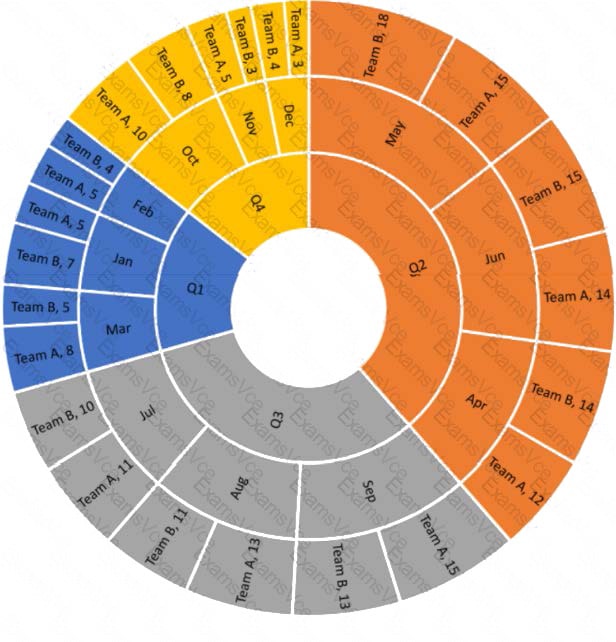
A. Q2 was the strongest performing quarter with Team B having the top monthly sales in May
B. Q3 was the strongest performing quarter with Team A having the top monthly sales in the quarter
C. Q4 was the lowest performing quarter with November having the lowest monthly sales in the year
D. Q4 was the lowest performing quarter with Team A having the lowest monthly sales in the Quarter
Correct Answer: C
The chart visualizes monthly sales data for two teams over a year, divided into quarters. By analyzing the data, it is evident that November (part of Q4) had the lowest monthly sales in the year, making option C correct. There isn't enough information to verify the performance of individual teams in each quarter as per Business Data Analytics (IIBA - CBDA) objectives and resources.
Question 110:
A government agency is conducting a study on the performance of 12th grade students' in mathematics across the country. In particular, they want to understand if there is a relationship between intelligence and scores, as well as the difference in performance between various locations. Which combination of inferential statistics procedures should be used?
A. Range, standard deviation
B. Mean, median
C. Correlation co-efficient, analysis of variance
D. Frequency distribution, time-series
Correct Answer: C
A correlation co-efficient is a measure of the strength and direction of the linear relationship between two variables, such as intelligence and scores. A correlation co-efficient can range from -1 to 1, where -1 indicates a perfect negative relationship, 0 indicates no relationship, and 1 indicates a perfect positive relationship12. An analysis of variance (ANOVA) is a procedure that tests whether the means of two or more groups are significantly different from each other, such as the performance of students across various locations. ANOVA can compare the variation within eachgroup and the variation between groups to determine if there is a statistically significant difference among the group means34.
Nowadays, the certification exams become more and more important and required by more and more enterprises when applying for a job. But how to prepare for the exam effectively? How to prepare for the exam in a short time with less efforts? How to get a ideal result and how to find the most reliable resources? Here on Vcedump.com, you will find all the answers. Vcedump.com provide not only IIBA exam questions, answers and explanations but also complete assistance on your exam preparation and certification application. If you are confused on your CBDA exam preparations and IIBA certification application, do not hesitate to visit our Vcedump.com to find your solutions here.