C2020-011 Exam Details
-
Exam Code
:C2020-011 -
Exam Name
:IBM SPSS Statistics Level 1 v2 -
Certification
:IBM Certifications -
Vendor
:IBM -
Total Questions
:60 Q&As -
Last Updated
:Jan 05, 2020
IBM C2020-011 Online Questions & Answers
-
Question 51:
The Compute Variable dialog shown below performs which of the followingoperations? (Choose two.)
A. Sets the value of ParentEduc equal to the value of MAEDUC.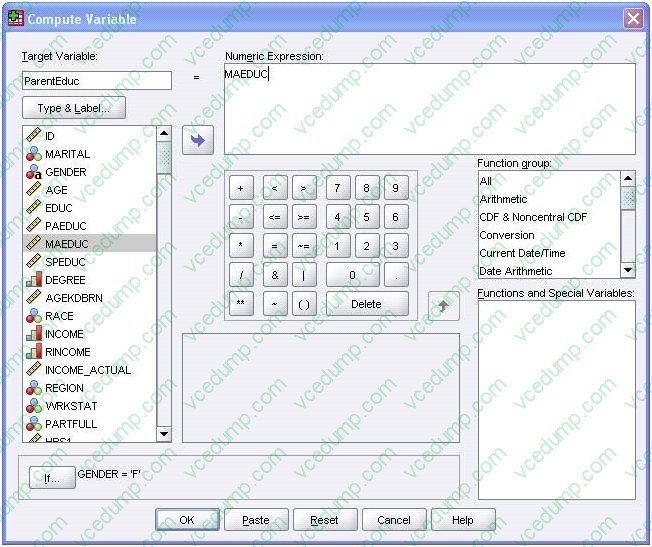
B. Sets the value of ParentEduc equal to the value of MAEDUC if the value of GENDER is
D. Sets the value of ParentEduc equal to the system-missing value if the value of GENDER is blank.
E. Sets the value of ParentEduc equal to the user-missing value if the value of GENDER is blank. -
Question 52:
Which Pivoting Tray corresponds to the illustrated cross tabulation?
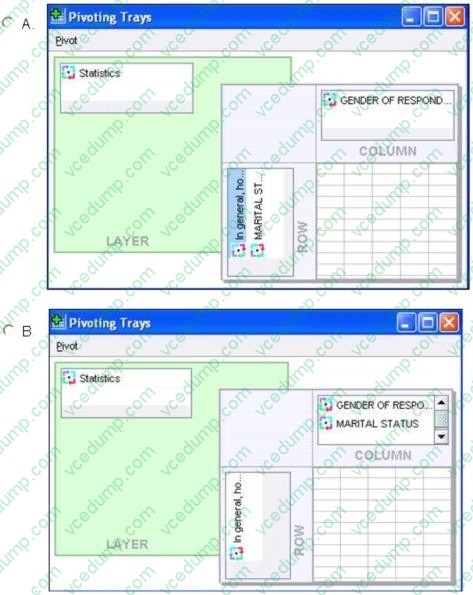
A. Option A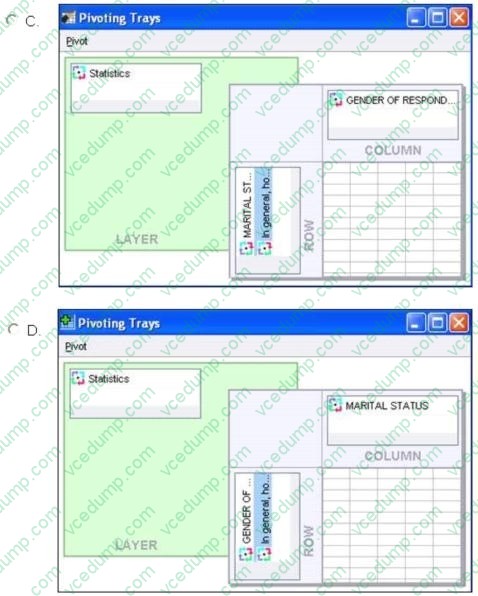
B. Option B
C. Option C
D. Option D -
Question 53:
You have been asked to create a categorical variable from a scale variable, income, illustrated in the histogram below. The resulting categorical variable must have 5 categories with an approximately equal number of cases in each category. Which way would you accomplish this using the IBM SPSS Statistics Visual Binning dialog?
A. Use the automatic option Equal Width Intervals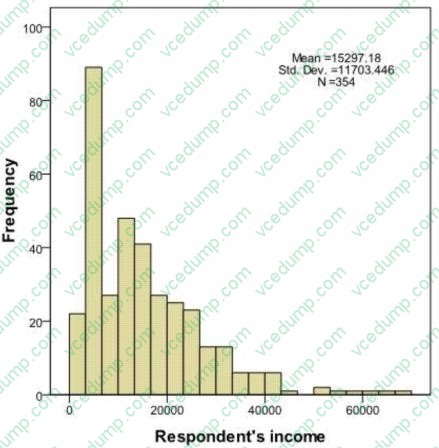
B. Use the automatic option Equal Percentiles Based on Scanned Cases
C. Use the automatic option Outpoints at Mean and Selected Standard Deviations Based on Scanned Cases
D. Specify Cut points manually at 10000, 20000, 30000, 40000 and 50000. -
Question 54:
There are two major types of errors one can make when attempting to draw conclusions about the larger population based on the information collected in the sample. For example, when performing an Independent Samples T-Test, one type of error that can occur is when there are significant differences between the groups based on a scale level dependent variable, but the test fails to detect them. Which of the following choices describe this sort of error? (Choose two.)
A. Type i error
B. Type ii error
C. False negative
D. False positive -
Question 55:
If you use the IBM SPSS Statistics Select Cases dialog to conduct analysis on a subset of cases and you want to keep all cases in the same dataset, which option is appropriate?
A. Copy unselected cases to a new dataset
B. Copy selected cases to a new dataset
C. Delete unselected cases
D. Filter out unselected cases -
Question 56:
For a variable salary we have the statistics as shown in the figure below.
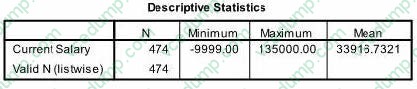
The reported Mean is incorrect because a value, -9999, is included in its calculation. How can this situation be fixed?
A. Define -9999 as a system-missing value.
B. Remove allcases with the value -9999 for the variable salary from the data file.
C. Define -9999 as a user-missing value.
D. Define -9999 as both a system- and user-missing value. -
Question 57:
If you build an expression manually, as opposed to using a function (e.g., specify (V1+V2)/2 instead of MEAN (V1 , V2)), which statement is true?
A. If any of the variables usedin the expression has a missing value, it will be ignored and the expression will proceed to evaluate with variables that have valid values.
B. It will always return a valid value for each case, regardless of whether one or more of the source variablevalues are missing.
C. If any of the variables used in the expression has a missing value, the result for that case is a system-missing value.
D. If any of the variables used in the expression has a missing value, you will get a notification pointing thisout before you proceed. -
Question 58:
What happens when you use the Output option Filter out unselected cases in the Select Cases... dialog to create a filter variable and retain all cases in the same data file?
A. A new variable called filter? is created. Cases with a value of 1 for this variable have a slash through their row number, indicating they are not selected.
B. A new variable called filter I is created. Cases with a value of U for this variable have a slash through their row number, indicating they are unselected and the message Filter On appears on the status bar of the Data Editor.
C. A new variable called filter $ is created. Cases with a value of 0 for this variable have a slash through their row number, indicating they are unselected and the message Filter On appears on the status bar of the Data Editor.
D. A new variable called filter $ is created. Cases with a value of 1 for this variable have a slash through their row number, indicating they are unselected and the message Filter On appears on the status bar of the Data Editor. -
Question 59:
Which chart type is appropriate for viewing the association between two scale variables?
A. Bar chart
B. Area chart
C. Pie chart
D. Scatter plot -
Question 60:
Consider the data filebelow and answer the following: The calculation of the mean of the variables X, Y, Z is contained in the variable Av_XYZ. What method was used to calculate the mean?
A. The Compute Variable dialog and the expression (X+Y+Z) 13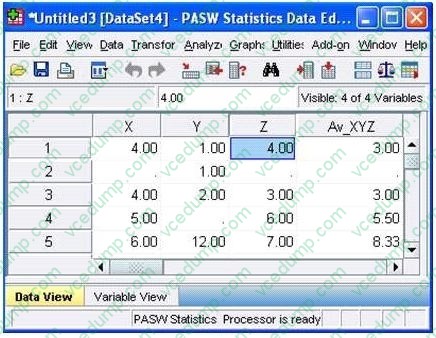
B. The Compute Variabledialog and the expression X+Y+Z/3
C. The Compute Variable dialog and the expression MEAN(X, Y, Z)
D. The Compute Variable dialog and the expression MEAN.2(X, Y, Z)
Related Exams:
-
C1000-002
IBM MQ V9.0 System Administration -
C1000-003
IBM Mobile Foundation v8.0 Application Development -
C1000-004
IBM Curam SPM V7.X Application Developer -
C1000-007
IBM Cloud Application Development v3 -
C1000-010
IBM Operational Decision Manager Standard V8.9.1 Application Development -
C1000-012
IBM Watson Application Developer V3.1 -
C1000-015
IBM Business Process Manager V8.6 Application Development using Process Designer -
C1000-018
IBM QRadar SIEM V7.3.2 Fundamental Analysis -
C1000-019
IBM Spectrum Protect Plus V10.1.1 Implementation -
C1000-020
IBM New Workloads Sales V2
Tips on How to Prepare for the Exams
Nowadays, the certification exams become more and more important and required by more and more enterprises when applying for a job. But how to prepare for the exam effectively? How to prepare for the exam in a short time with less efforts? How to get a ideal result and how to find the most reliable resources? Here on Vcedump.com, you will find all the answers. Vcedump.com provide not only IBM exam questions, answers and explanations but also complete assistance on your exam preparation and certification application. If you are confused on your C2020-011 exam preparations and IBM certification application, do not hesitate to visit our Vcedump.com to find your solutions here.