Exam Details
Exam Code
:ICBBExam Name
:IASSC Certified - Lean Six Sigma Black BeltCertification
:IASSC CertificationsVendor
:IASSCTotal Questions
:424 Q&AsLast Updated
:Jun 09, 2025
IASSC IASSC Certifications ICBB Questions & Answers
-
Question 351:
Statistical Difference is the magnitude of difference or change required to distinguish between a true difference, brought about by change or improvement, and one that could have occurred by chance.
A. True
B. False
-
Question 352:
The validity of the decision made with Hypothesis Testing is dependent upon all of these except ___________________.
A. Beta risk
B. Alpha risk
C. Range of data
D. Sample size
-
Question 353:
A(n) ________________ has occurred when two inputs have a greater impact on a change in the output than either of the inputs has by itself.
A. Dependency
B. Bimodal reaction
C. Interaction
D. Amplified effect
-
Question 354:
When conducting a Hypothesis Test using Continuous Data the proper sample size is influenced by the extent to which we need to assess a Difference to be detected and the inherent variation in the process.
A. True
B. False
-
Question 355:
What conclusion is most correct about the Experimental Design shown here with the response in the far right column?

A. No factor has enough statistical confidence greater than 95% to have an impact on the response rate
B. Constant, Adv and Bev are the only factors statistically affecting the response rate with 95% confidence or more
C. If the Adv is increased from the low level to the high level, the response rate increases
D. The response level is statistically concluded to only need the Adv and Bev factors set at the low level to get the largest response rate
E. This design does not have enough experimental runs to conclude anything as evidenced by the lack of P-values in the MINITABTM output
-
Question 356:
A Lean Six Sigma project is attempting to reduce inventory days. The Process Capability will be monitored as part of the Control Phase to track the sustainability of the improvement.
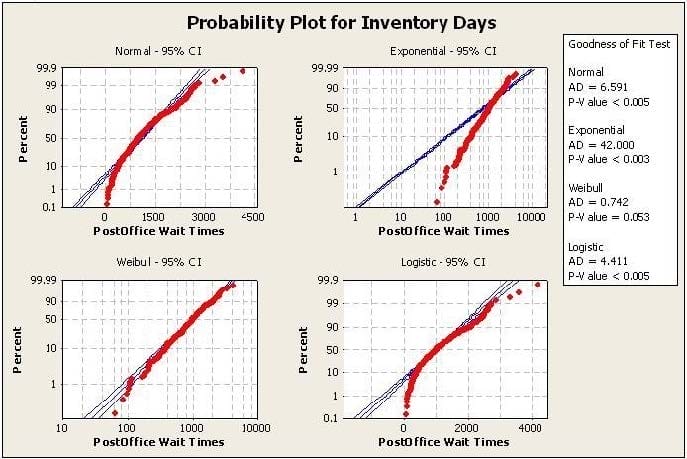
Which distribution type is best used for performing the Capability Analysis?
A. Weibull Distribution
B. Normal Distribution
C. Exponential Distribution
D. Logistic Distribution
E. Gaussian Distribution
-
Question 357:
Review the analysis shown here.
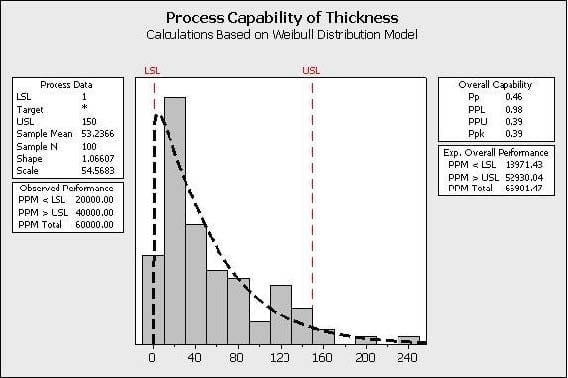
Which statements are true about the process? (Note: There are 3 correct answers).
A. The initial focus for this project would be to determine why the thicknesses are so frequently too low.
B. The majority of the process is closer to the lower specification limit.
C. This process is described with the Weibull Distribution.
D. The process has more problems with Variation than Centering.
E. The process follows a non-normal distribution with the given data.
-
Question 358:
For the data set shown here which of these statements is/are true?
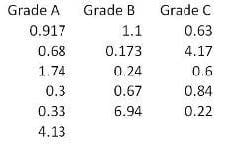
A. Hypothesis Testing of Means or Medians cannot be done since there are an unequal number of observations for the 3 samples
B. A Paired T-test would be applicable for comparing Grade B and Grade A since they follow each other in the data set
C. Grade A has the lowest sample Mean of the 3 samples
D. Grade A has a higher sample Mean than Grade B
-
Question 359:
A(n) ______________ is best used to compare a Machine 1 average quality characteristic to the same quality characteristic of Machine 2.
A. F test
B. 1-Sample t-test
C. 2-Sample t-test
D. ANOVA test
-
Question 360:
Contingency Tables are used to test for association, or dependency, between two or more classifications.
A. True
B. False
Tips on How to Prepare for the Exams
Nowadays, the certification exams become more and more important and required by more and more enterprises when applying for a job. But how to prepare for the exam effectively? How to prepare for the exam in a short time with less efforts? How to get a ideal result and how to find the most reliable resources? Here on Vcedump.com, you will find all the answers. Vcedump.com provide not only IASSC exam questions, answers and explanations but also complete assistance on your exam preparation and certification application. If you are confused on your ICBB exam preparations and IASSC certification application, do not hesitate to visit our Vcedump.com to find your solutions here.