Exam Details
Exam Code
:CSSBBExam Name
:Certified Six Sigma Black Belt - CSSBBCertification
:ASQ CertificationsVendor
:ASQTotal Questions
:300 Q&AsLast Updated
:Jun 30, 2025
ASQ ASQ Certifications CSSBB Questions & Answers
-
Question 201:
Review the analysis shown here. Which statements are true about the process? (Note: There are 3 correct answers).
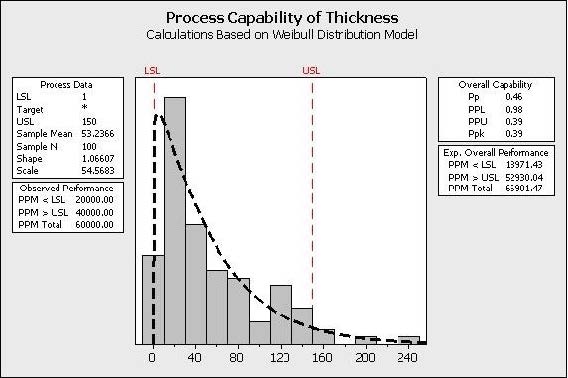
A. The initial focus for this project would be to determine why the thicknesses are so frequently too low
B. The majority of the process is closer to the lower specification limit
C. This process is described with the Weibull Distribution
D. The process has more problems with Variation than Centering
E. The process follows a non-normal distribution with the given data
-
Question 202:
The Waste of Overproduction is defined as ______________________.
A. The unnecessary movement of people and equipment
B. The liability of materials that are bought, invested in and not immediately sold or used
C. Producing more than the next step needs or more than the customer buys
D. The extra movement of material
-
Question 203:
Which statement(s) are incorrect for the Regression Analysis shown here? (Note: There are 2 correct answers).
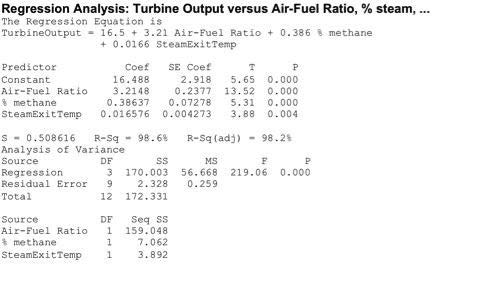
A. The air-fuel ratio explains most of the TurbineOutput variation
B. The Regression explains over 98% of the process variation
C. This Multiple Linear Regression has three statistically significant independent variables
D. If the air-fuel ratio increases by 1, the TurbineOutput more than triples
E. The SteamExitTemp explains the most variation of the TurbineOutput
-
Question 204:
Situations where standardized work needs to be incorporated include all of these except _____________________.
A. Machines continually operating to reduce the labor cost per piece
B. Lack of a system to assure proper inventory levels at repair stations
C. Changeover instructions incomplete
D. Process flow for the same product assembly taking various cycle time for completion
-
Question 205:
Calculate the Rolled Throughput Yield of this process using this data.
DatA. unit input: 1450, unit output: 1390, defects repaireD. 320, scrap: 60
A. 71.33%
B. 72.66%
C. 73.79%
D. 77.93%
-
Question 206:
When the Inputs, X's, for your process are Normally Distributed about the Mean, the Outputs, Y's, will be Normally Distributed.
A. True
B. False
-
Question 207:
Appropriate measures means that measurements are ______________.
A. Representative
B. Sufficient
C. Contextual
D. Relevant
E. All of these answers are correct
-
Question 208:
Which of these graphs demonstrates conditions which would be sufficient to enable OCAP for the process?
A. Xbar Chart
B. Time Series Chart
C. Neither
D. Both
-
Question 209:
A statistical test or Hypothesis Test is performed to reject or fail to reject a stated hypothesis and it converts the Practical Problem into a Statistical Problem.
A. True
B. False
-
Question 210:
A valuable tool to use during the Measure Phase to show material and information flow throughout an entire process is the ______________ .
A. Value Stream Map
B. FMEA
C. Pareto Chart
D. Standard Operating Procedure
Tips on How to Prepare for the Exams
Nowadays, the certification exams become more and more important and required by more and more enterprises when applying for a job. But how to prepare for the exam effectively? How to prepare for the exam in a short time with less efforts? How to get a ideal result and how to find the most reliable resources? Here on Vcedump.com, you will find all the answers. Vcedump.com provide not only ASQ exam questions, answers and explanations but also complete assistance on your exam preparation and certification application. If you are confused on your CSSBB exam preparations and ASQ certification application, do not hesitate to visit our Vcedump.com to find your solutions here.