70-778 Exam Details
-
Exam Code
:70-778 -
Exam Name
:Analyzing and Visualizing Data with Microsoft Power BI -
Certification
:Microsoft Certifications -
Vendor
:Microsoft -
Total Questions
:155 Q&As -
Last Updated
:Oct 16, 2021
Microsoft 70-778 Online Questions & Answers
-
Question 121:
Note: This question is a part of a series of questions that present the same scenario. Each question in the series contains a unique solution that might meet the stated goals. Some question sets might have more than one correct solution,
while others might not have a correct solution.
After you answer a question in this section, you will NOT be able to return to it. As a result, these questions will not appear in the review screen.
Your company has 1,000 users in a Microsoft Office 365 subscription.
A Power BI administrator named Admin1 creates 20 dashboards and shares them with 50 users.
You discover that a use name User1 can access all the dashboards.
You need to prevent User1 from accessing all the dashboards.
Solution: From Microsoft Azure Active Directory, you remove the Power BI license from User1.
Does this meet the goal?
A. Yes
B. No -
Question 122:
HOTSPOT
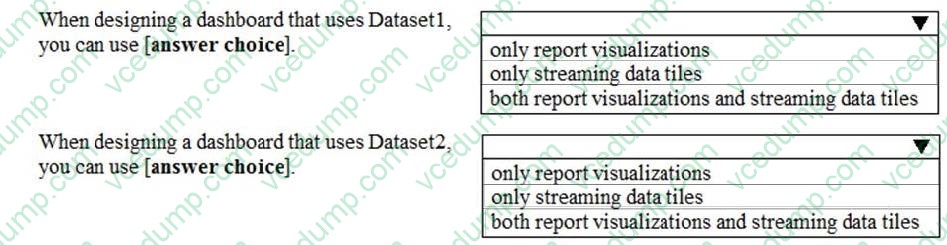
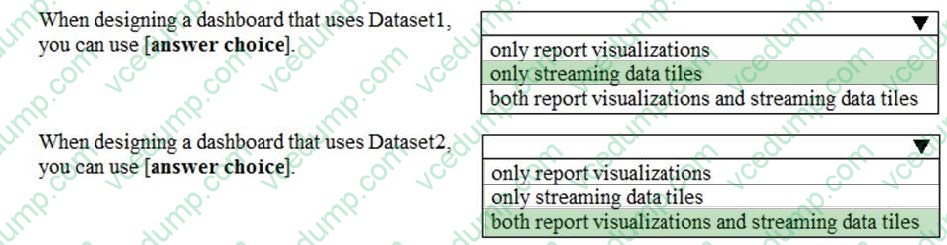
You have the datasets shown in the following graphic.

Use the drop-down menus to select the answer choice that completes each statement based on the information presented in the graphic.
Note: Each selection is worth one point.
Hot Area:
-
Question 123:
Note: This question is part of a series of questions that present the same scenario. Each question in the series contains a unique solution that might meet the stated goals. Some question sets might have more than one correct solution, while
others might not have a correct solution.
After you answer a question in this section, you will NOT be able to return to it. As a result, these questions will not appear in the review screen.
You have a user named User1. User1 is a member of a security group named Contoso PowerBI.
User1 has access to a workspace named Contoso Workspace.
You need to prevent User1 from exporting data from the visualizations in Contoso Workspace.
Solution: From the Microsoft Office 365 Admin center, you modify the properties of Contoso PowerBI.
Does this meet the goal?
A. Yes
B. No -
Question 124:
DRAG DROP
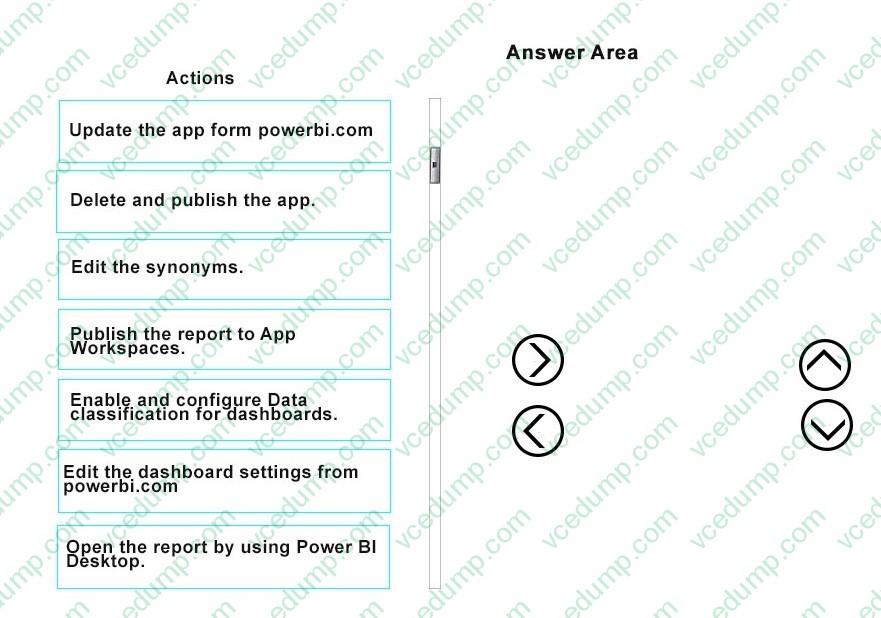
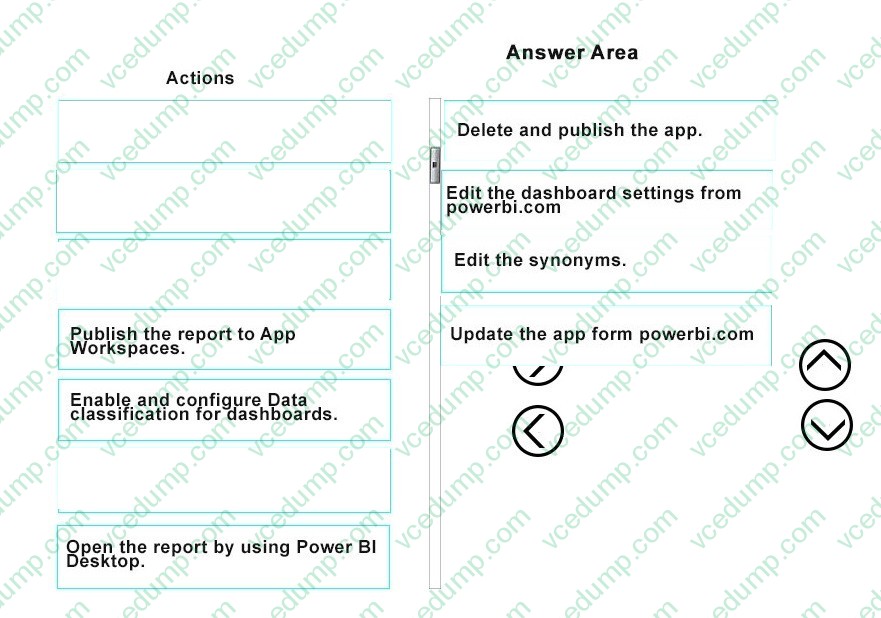
From Power BI Desktop, you publish an app that contains one dashboard and one report.
QandA is enabled on the dashboard.
In QandA, a user types the query count of clients and fails to receive any results. The user then types the query count of subscribers and received the expected results.
You need to ensure that the user can use both queries to receive the same results.
Which four actions should you perform in sequence? To answer, move the appropriate actions form the list of actions to the answer area and arrange them in the correct order.
Select and Place:
-
Question 125:
HOTSPOT
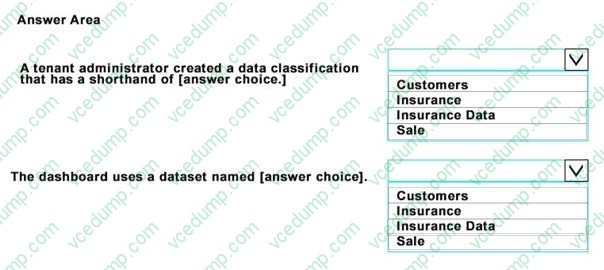
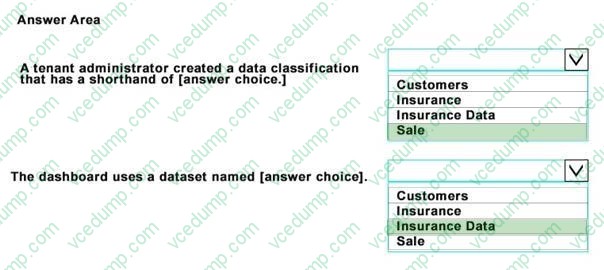
You open powerbi.com as shown in the following exhibit.
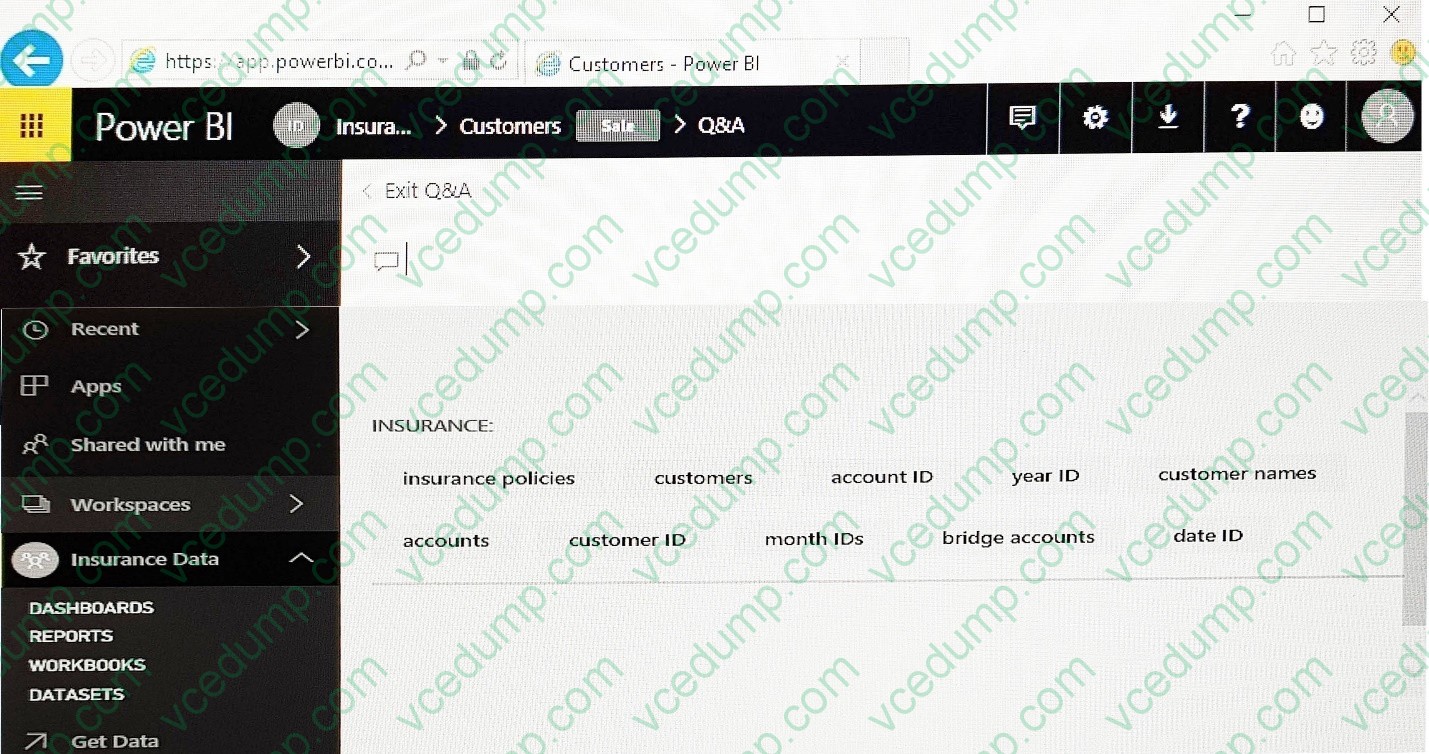
Use the drop-down menus to select the answer choice that completes each statement based on the information presented in the graphic. NOTE: Each correct selection is worth one point.
Hot Area:
-
Question 126:
DRAG DROP
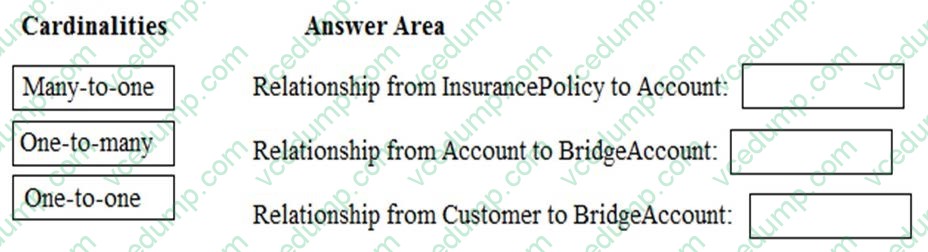
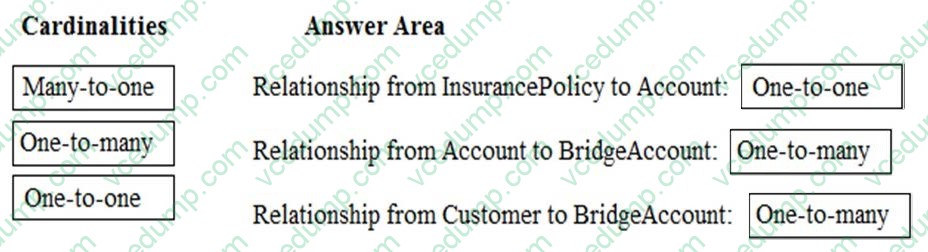
A customer can have multiple accounts. An account can only be associated to one customer. Each account is associated to only one insurance policy.
You need to configure the relationships between the tables to ensure that you can create a report displaying customers and their associated insurance policies.
How should you configure each relationship? To answer, drag the appropriate cardinalities to the correct relationships. Each value may be used once, more than once, or not at all.
You may need to drag the split bar between panes or scroll to view content.
NOTE: Each correct selection is worth one point.
Select and Place:
-
Question 127:
You have the following tables.
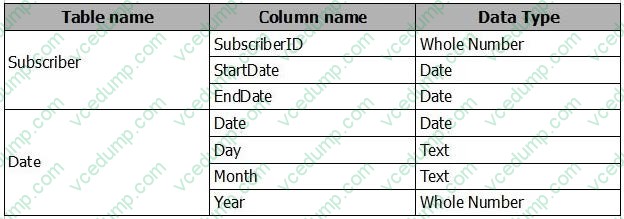
There is a many-to-one relationship from Subscriber to Date that uses Subscriber[StartDate] and Date[Date]. The Cross filter direction of the relationship is set to Single.
You plan to create a column chart that displays the following two measures:
Count of SubscriberID by Month based on the StartDate Count of SubscriberID by Month based on the EndDate
What should you do before you create the measures?
A. Create an active one-to-one relationship from Subscriber[StartDate] to Date[Date].
B. Change the Cross filter direction of the active relationship to Both.
C. Change the active relationship for many-to-one.
D. Create an inactive many-to-one relationship from Subscriber[StartDate] to Date[Date]. -
Question 128:
You have a Power BI model that has a date table. A sample of the data shown in the following table.
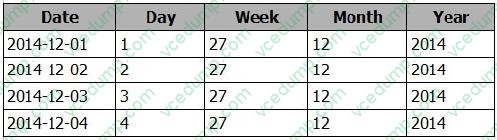
You need to add a column to display the date in the format of December 01, 2014. Which DAX formula should you use in Power BI Desktop?
A. FORMAT([Date], "MMM") and " " and FORMAT([Date], "DO") and ", " and FORMAT([Date], "YYYY")
B. FORMAT([Date], "MM") and " " and FORMAT([Date], "DO") and ", " and FORMAT([Date], "YYYY")
C. [Date].[Month] and " " and FORMAT([Date], "D") and ", " and [Date].[Year])
D. FORMAT([Date], "MMMM DO, YYYY") -
Question 129:
DRAG DROP
You have the following two tables:
There is a relationship between Subscriber [EnrollmentDate] and Date[Date].
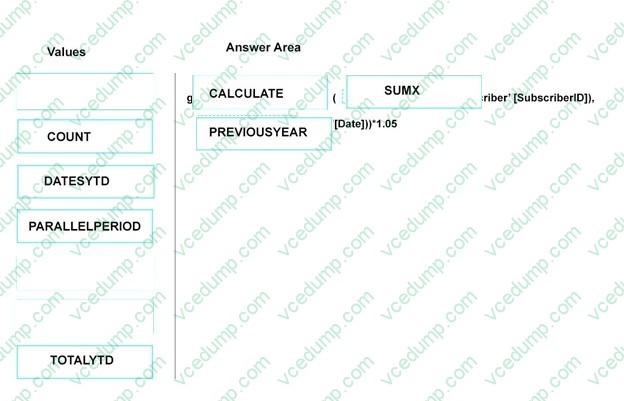
You plan to create a KPI for the number of subscribers enrolled in the current year.
You need to create a goal that is five percent more than the number of subscribers enrolled during the previous calendar year.
How should you complete the DAX formula? To answer, drag the appropriate values to the correct targets. Each value may be used once, more than once, or not at all. You may need to drag the split bar between panes or scroll to view content.
NOTE: Each correct selection is worth one point.
Select and Place:

-
Question 130:
From the Home tab in Power BI Desktop, you click Enter Data and create a table named Sales that contains the following data.
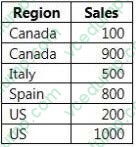
You add Region and Sales to a visualization and the visualization displays the following data.
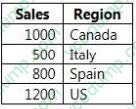
What causes the visualization to display four rows of data instead of six?
A. the Data Category of Region
B. the Default Summarization on Region
C. the Default Summarization on Sales
D. the Data Category of Sales
Related Exams:
-
62-193
Technology Literacy for Educators -
70-243
Administering and Deploying System Center 2012 Configuration Manager -
70-355
Universal Windows Platform – App Data, Services, and Coding Patterns -
77-420
Excel 2013 -
77-427
Excel 2013 Expert Part One -
77-725
Word 2016 Core Document Creation, Collaboration and Communication -
77-726
Word 2016 Expert Creating Documents for Effective Communication -
77-727
Excel 2016 Core Data Analysis, Manipulation, and Presentation -
77-728
Excel 2016 Expert: Interpreting Data for Insights -
77-731
Outlook 2016 Core Communication, Collaboration and Email Skills
Tips on How to Prepare for the Exams
Nowadays, the certification exams become more and more important and required by more and more enterprises when applying for a job. But how to prepare for the exam effectively? How to prepare for the exam in a short time with less efforts? How to get a ideal result and how to find the most reliable resources? Here on Vcedump.com, you will find all the answers. Vcedump.com provide not only Microsoft exam questions, answers and explanations but also complete assistance on your exam preparation and certification application. If you are confused on your 70-778 exam preparations and Microsoft certification application, do not hesitate to visit our Vcedump.com to find your solutions here.