70-778 Exam Details
-
Exam Code
:70-778 -
Exam Name
:Analyzing and Visualizing Data with Microsoft Power BI -
Certification
:Microsoft Certifications -
Vendor
:Microsoft -
Total Questions
:155 Q&As -
Last Updated
:Oct 16, 2021
Microsoft 70-778 Online Questions & Answers
-
Question 91:
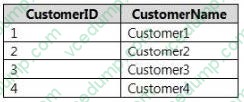
You have two tables named Customer and Orders. A sample of the Data in Customer is shown in the following table.
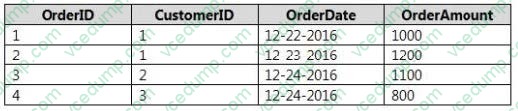
A sample of the data in Orders is shown in the following table.
You need to create the following new table.
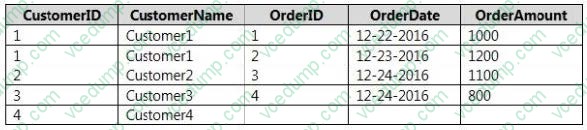
You must use Customer as the first table. Which join kind should you use?
A. Right Anti
B. Right Outer
C. Left Anti
D. Left Outer
E. Inner -
Question 92:
You have a Power BI Desktop project that uses DirectQuery to access an on-premises Microsoft SQL Server database. From Power BI Desktop, you can query the database. When you publish the Power BI Desktop project to the Power BI service, the visualizations cannot display the data. What should you do to resolve the issue?
A. Locate the published dataset for the project in the Power BI service and configure the data source credentials.
B. Install the on-premises data gateway (personal mode) and republish the project.
C. Install the on-premises data gateway and configure a data source.
D. Configure a Microsoft Azure ExpressRoute connection between the on-premises network and the Power BI service. -
Question 93:
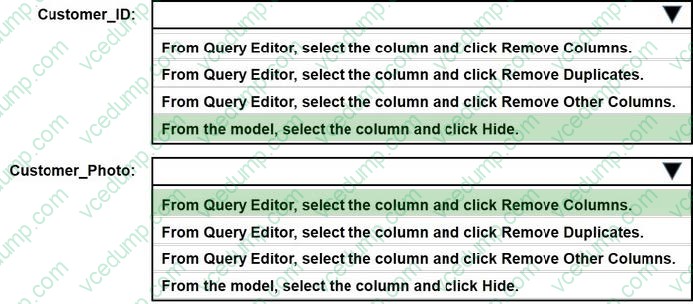
You are creating reports in Power BI Desktop. The model has the following tables.
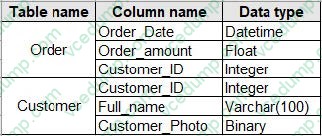
There is a relationship between the tables.
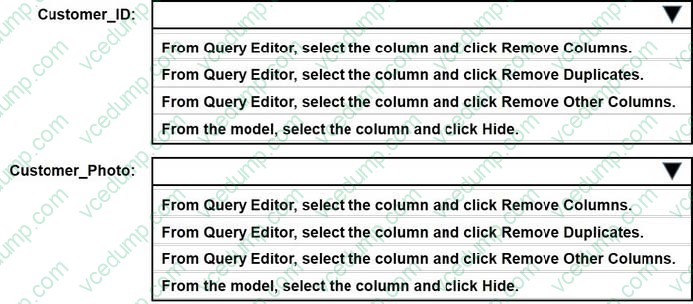
You plan to publish a report to the Power BI service that displays Order_amount by Order_date by Full_name.
You need to ensure that only the columns required for the report appear in Report View. The solution must minimize the size of the dataset that is published.
How should you configure the columns in Power BI Desktop? To answer, select the appropriate options in the answer area.
NOTE: Each correct selection is worth one point.
Hot Area:
-
Question 94:
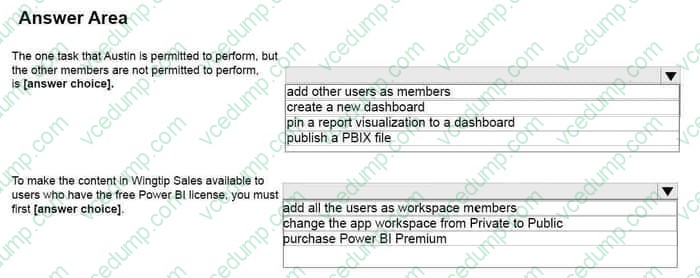
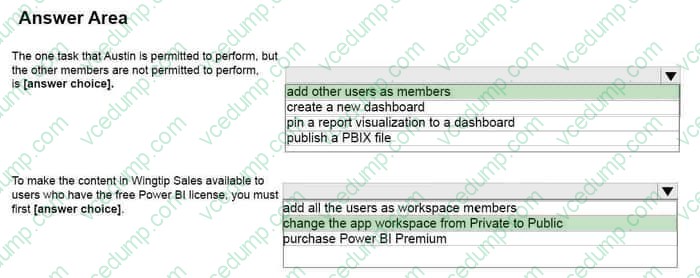
You create an app workspace named Wingtip Sales. Wingtip Sales is configured as shown in the following exhibit.
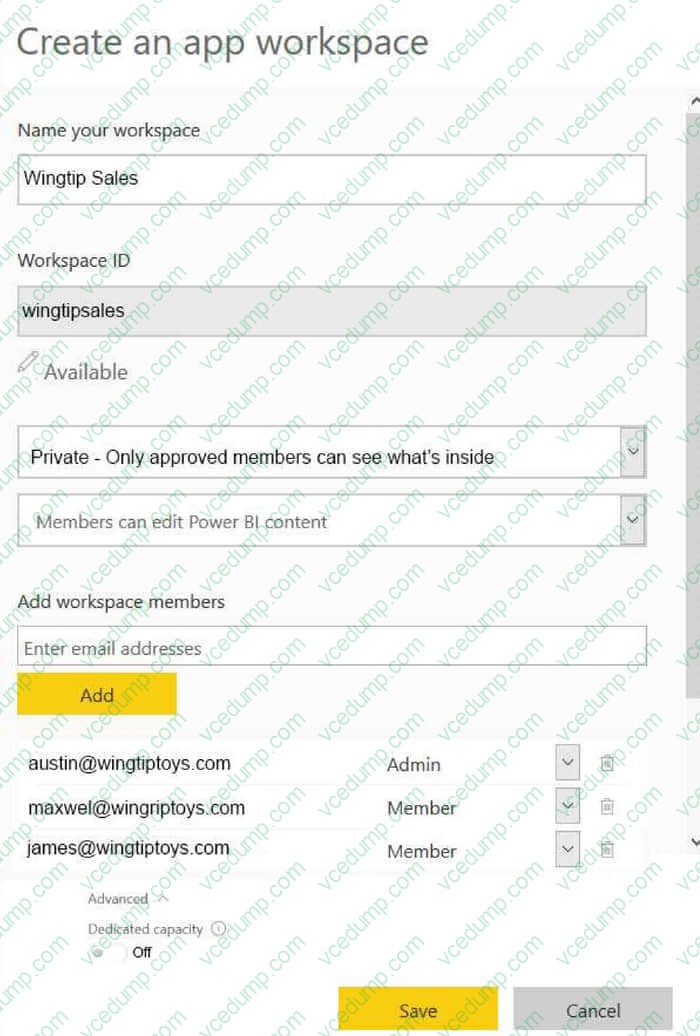
Use the drop-down menus to select the answer choice that completes each statement based on the information presented in the graphic. NOTE: Each correct selection is worth one point.
Hot Area:
-
Question 95:
You are creating a report in Power BI Desktop. You are consuming the following tables.
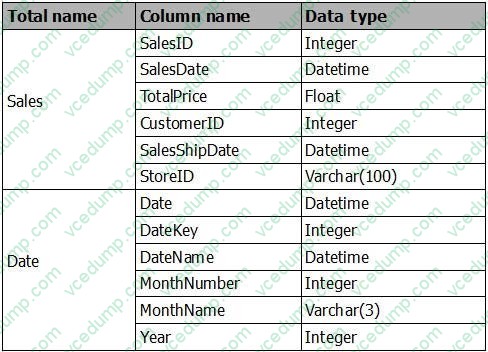
You have a new table named Fiscal that has the same schema as the Date table, but contains the fiscal dates of your company.
You need to create a report that displays the total sales by fiscal month and calendar month.
What should you do?
A. Union Fiscal and Date as one table.
B. Add Fiscal to the model and create a one-to-many relationship by using Date[Year] and Fiscal[Year].
C. Add Fiscal to the model and create a one-to-one relationship by using Date[Year] and Fiscal[Year].
D. Merge Fiscal into the Date table. -
Question 96:
You have a Microsoft Excel 2016 workbook that has a Power Pivot model. The model contains the following tables:
Product (Product_id, Producct_Name)
Sales (Order_id, Order_Date, Product_id, Selasperson_id, Sales_Amount) Salesperson (Salesperson_id, Salesperson_name, address)
The model has the following relationships:
Sales to Product
Sales to Salesperson
You create a new Power BI file and import the Power Pivot model.
You need to ensure that you can generate a report that displays the count of products sold by each salesperson.
What should you do before you create the report?
A. Create a many-to-one relationship between Product and Salesperson.
B. For each relashionship, change the Cardinality to One to One (1:1).
C. Create a one-to-one relashionship between Product and Salesporson.
D. For each relationship, change the Cross filter direction to Both. -
Question 97:
Note: This question is part of a series of questions that present the same scenario. Each question in the series contains a unique solution that might meet the stated goals. Some question sets might have more than one correct solution, while
others might not have a correct solution.
After you answer a question in this section, you will NOT be able to return to it. As a result, these questions will not appear in the review screen.
You have a Power BI model that contains two tables named Sales and Date. Sales contains four columns named TotalCost, DueDate, ShipDate, and OrderDate. Date contains one column named Date.
The tables have the following relationships:
The active relationship is on Sales[DueDate].
You need to create measures to count the number of orders by [ShipDate] and the orders by [OrderDate]. You must meet the goal without duplicating data or loading additional data.
Solution: You create measures that use the CALCULATE, COUNT, and FILTER DAX functions.
Does this meet the goal?
A. Yes
B. No -
Question 98:
You plan to use Power BI Desktop to create a report. The report will consume data from an on-premises tabular named SalesDB in Microsoft SQL Server Analysis Services (SSAS). The report will be published to the Power BI service.
You need to ensure that the report published to the Power BI service will access the current data in SalesDB.
What should you do?
A. Deploy an on-premises data gateway and configure the connection to SalesDB to use the Import Data Connectivity mode.
B. Deploy an on-premises data gateway and configure the connection to SalesDB to use the Connect live option.
C. Deploy an on-premises data gateway (personal mode) and configure to SalesDB to use the DirectQuery Data Connectivity mode.
D. Deploy an on-premises data gateway and configure the connection to SalesDB to use the DirectQuery Data Connectivity mode. -
Question 99:
You have a Power BI report that displays a bar chart and a donut chart on the same page. The bar chart shows the total sales by year and the donut chart shows the total sale by category.
You need to ensure that when you select a year on the bar chart, the donut remains unchanged.
What should you do?
A. Set a visual level filter on the bar chart.
B. Edit the interactions form the Format menu.
C. Set a visual level filter on the donut chart.
D. Add a slicer to the page that uses the year column. -
Question 100:
You have a Power BI dashboard that displays different visualizations of company sales.
You enable QandA on the dashboard.
You need to provide users with sample questions that they can ask when using QandA.
Which settings should you modify from the Power BI Settings?
A. Subscriptions
B. Dashboards
C. Datasets
D. Workbooks
Related Exams:
-
62-193
Technology Literacy for Educators -
70-243
Administering and Deploying System Center 2012 Configuration Manager -
70-355
Universal Windows Platform – App Data, Services, and Coding Patterns -
77-420
Excel 2013 -
77-427
Excel 2013 Expert Part One -
77-725
Word 2016 Core Document Creation, Collaboration and Communication -
77-726
Word 2016 Expert Creating Documents for Effective Communication -
77-727
Excel 2016 Core Data Analysis, Manipulation, and Presentation -
77-728
Excel 2016 Expert: Interpreting Data for Insights -
77-731
Outlook 2016 Core Communication, Collaboration and Email Skills
Tips on How to Prepare for the Exams
Nowadays, the certification exams become more and more important and required by more and more enterprises when applying for a job. But how to prepare for the exam effectively? How to prepare for the exam in a short time with less efforts? How to get a ideal result and how to find the most reliable resources? Here on Vcedump.com, you will find all the answers. Vcedump.com provide not only Microsoft exam questions, answers and explanations but also complete assistance on your exam preparation and certification application. If you are confused on your 70-778 exam preparations and Microsoft certification application, do not hesitate to visit our Vcedump.com to find your solutions here.