Q8
Hotspot
HOTSPOT
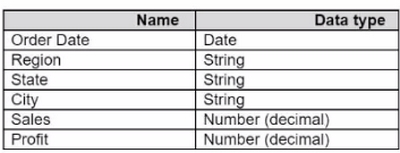
You have a data source that contains the following columns.
You have the following view that shows the percentage of total sales by category:
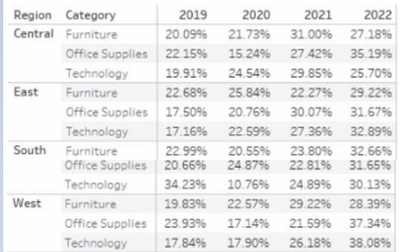
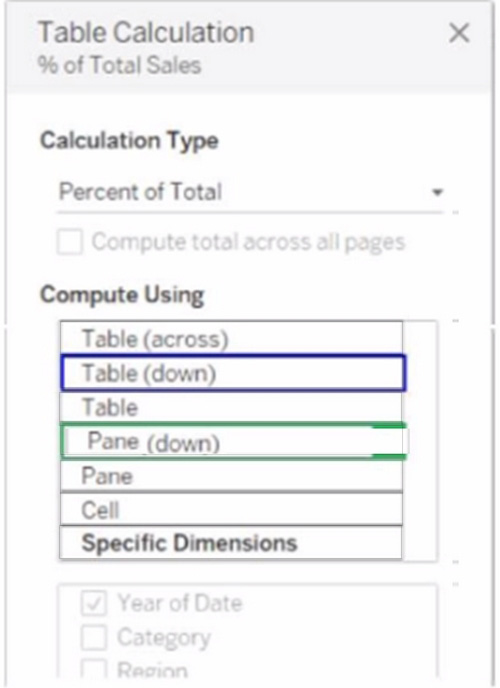
You want to change the calculation to show the percentage of total sales within the categories of every region annually.
Which Compute Using option should you use?
(Click the appropriate Option in the Answer Area.)
Select the correct area(s) on the image.