Q13
Single choice
Refer to the exhibit.
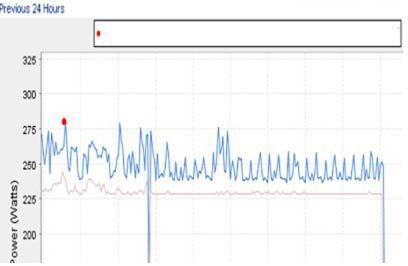
You selected a group of servers for power capping changes and generated the Group Power Consumption graph that is shown in the exhibit.
What information will be displayed in the box that describes the red dot?