TEAS-SECTION-3 Exam Details
-
Exam Code
:TEAS-SECTION-3 -
Exam Name
:Test of Essential Academic Skills - Math Problem Solving -
Certification
:TEAS Certifications -
Vendor
:TEAS -
Total Questions
:103 Q&As -
Last Updated
:
TEAS TEAS-SECTION-3 Online Questions & Answers
-
Question 1:
When a number is subtracted from 125 and the result is divided by 12, the answer obtained is twice the original number. What is the number?
A. 10
B. 5
C. 4
D. 25 -
Question 2:
What is the decimal equivalent of 0.33%?
A. 33.0
B. 0.0033
C. 0.033
D. 0.33 -
Question 3:
Solve the equation and choose the best answer. 9/b = b/4
A. 7
B. 6.2
C. 6
D. 36 -
Question 4:
Sebastian purchased a brand new car three years ago for $35,000. The following year its value was estimated at $23,850, and the year after that the price dropped to $20,400. Approximately what was the percentage change in the value of Sebastian's vehicle between one year and two years after its purchase?
A. -42%
B. 86%
C. -14%
D. 14% -
Question 5:
Arrange the numbers 0.09, 0.099, 0.9, 0.009, and 0.091 in order, from least to greatest.
A. 0.09, 0.9, 0.091, 0.099, 0.009
B. 0.009, 0.09, 0.9, 0.091, 0.099
C. 0.009, 0.09, 0.091, 0.099, 0.9
D. 0.09, 0.099, 0.009, 0.9, 0.091 -
Question 6:
Hamza purchased six 2-liter bottles of soft drink to serve at a pizza party with friends.
If the group drank 7,264 cubic centimeters of the soda during the party, about how many liters of soft drinks remained afterward?
A. 2 liters
B. 7 liters
C. 3 liters
D. 5 liters -
Question 7:
Which of the following is an improper fraction?
A. 2/3
B. 2.50
C. 5/2
D. 13/5 -
Question 8:
What is the number a, if the result of adding a to 80 is the same as subtracting 2a from 272?
A. -64
B. 64
C. 192
D. 62 -
Question 9:
What does 68% equal?
A. 6800
B. 0.68
C. 0.0068
D. 6.8 -
Question 10:
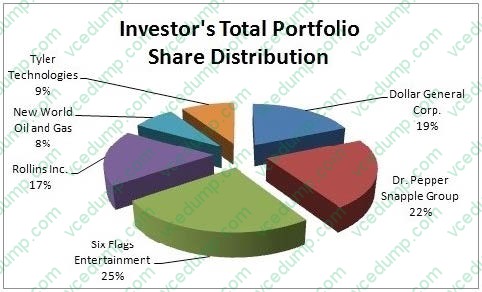
An investor purchased a total of 800 shares of stock from six different corporations. The graph represents the total number of shares in his portfolio and shows the distribution of shares purchased from each company. How many of the total shares were purchased from Dr. Pepper Snapple Group?
A. 176
B. 136
C. 190
D. 152
Related Exams:
Tips on How to Prepare for the Exams
Nowadays, the certification exams become more and more important and required by more and more enterprises when applying for a job. But how to prepare for the exam effectively? How to prepare for the exam in a short time with less efforts? How to get a ideal result and how to find the most reliable resources? Here on Vcedump.com, you will find all the answers. Vcedump.com provide not only TEAS exam questions, answers and explanations but also complete assistance on your exam preparation and certification application. If you are confused on your TEAS-SECTION-3 exam preparations and TEAS certification application, do not hesitate to visit our Vcedump.com to find your solutions here.