QSDA2022 Exam Details
-
Exam Code
:QSDA2022 -
Exam Name
:Qlik Sense Data Architect Certification - 2022 -
Certification
:QlikView Certifications -
Vendor
:QlikView -
Total Questions
:77 Q&As -
Last Updated
:Jul 13, 2026
QlikView QSDA2022 Online Questions & Answers
-
Question 21:
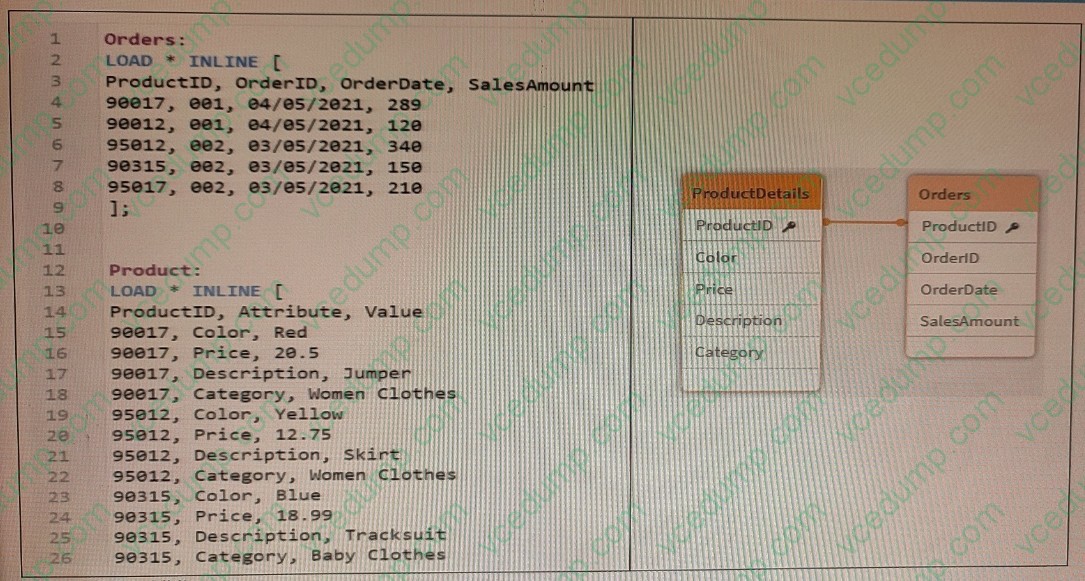
Refer to the exhibit.
A data architect is loading two tables: Orders and Product. The Product table includes attributes and values for each ProductID such as Colour, Price, Category, and Description.
The business analyst can filter by the value of these attributes. For performance reasons, the Data Model will use two tables.
Which solution should the data architect apply in the Data Load Editor to build the ProductDetails table?
For performance reasons, the Data Model will use two tables a Load Editor to build the ProductDetails table?
A. Use a For loop to concatenate all of the Products table and apply a Generic Load to the final concatenate table
B. Use a For loop to apply a Generic load to the Product table and concatenate the generic tables together
C. Use a Generic Load in the Product table and a For loop to left join each Generic table -
Question 22:
A data architect needs to efficiently prepare a data model for a meeting in an hour.
The data source to be used contains five date fields The app needs to display sales trends and compare the current year to date (CYTD) to last year to date (LYTD) The app is NOT going to be published It will only be used for this meeting
and a single user's ad-hoc analysis.
What should the data architect do to meet these requirements?
A. Use the data manager
B. Load a calendar island
C. Create a canonical calendar
D. Create five master calendars -
Question 23:
Refer to the exhibits.
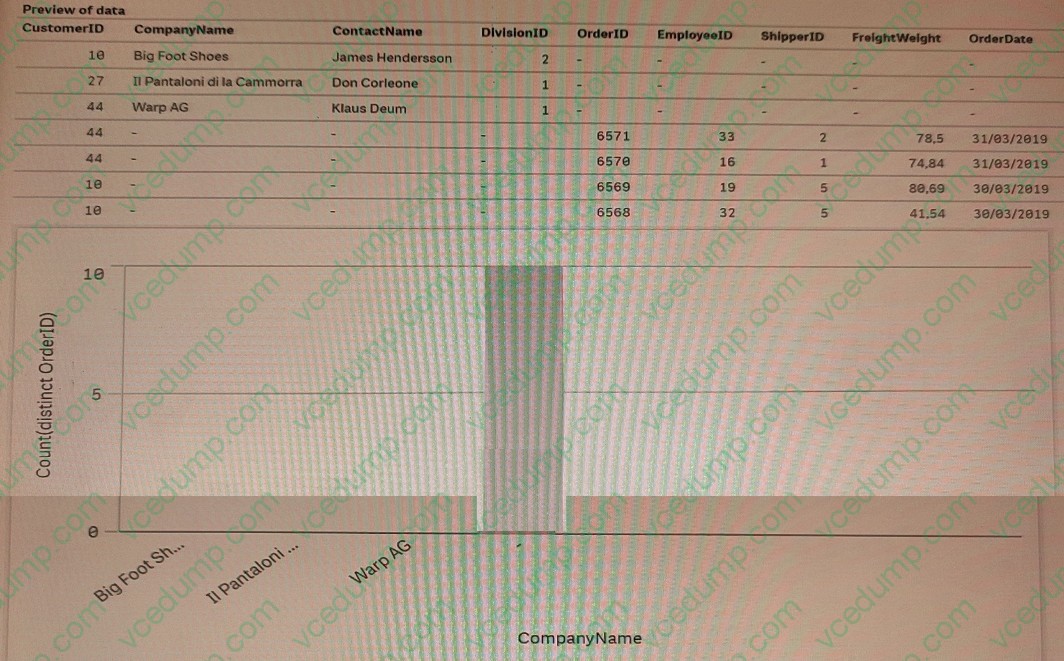
Some business users created an app by using the Add data functionality and loading two Excel files Orders and Customers.
The app is used to analyze the number of orders by customer. When the users create a bar chart to review the figures, the data shown is incorrect.
What should the data architect do to resolve this issue?
A. Open the data manager, split the Customers table, and associate both tables on CustomerlD field
B. Open the data manager, split the Customers table, and JOIN Orders and Customers on the CustomerlD field
C. Open the data load editor and use JOIN instead of concatenate to combine Orders and Customers by CustomerlD
D. Open the data load editor and apply a NOCONCATENATE function in the LOAD statement on the Orders table -
Question 24:
A customer has a dataset that contains latitude and longitude data for service points around the country. The data is retrieved using the following statement:
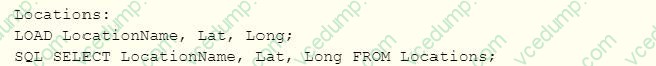
It must be clear to the end user that this is geographic data. Drag and drop, map-based visualization of this data is required. Which two steps should the data architect take to support this data? (Select two.)
A. Define Location as a master item, and set the tag to Sgeodata
B. Add GeoProject{' Point' , LatandLong) AS Point to the preceding load
C. Add GeoKakePoint (Lat, Long} as Point to Location's preceding load
D. Add the following to the end of the script: TAG FIELD LocationName With 'Sgeodata1, 'Srelated'; TAG FIELD Point With 'Sgeodata', 'Srelated1;
E. Add the following to the end of the script: TAG FIELD LocationName With 'Sgeoname', @relates_Pt'; TAG FIELD Point With 'Sgeopoint*f 'Srelates Location', '$hidden'; -
Question 25:
A data architect wants to combine data on present and historic sales performance. The historic data is stored in a de-normalized archive, and the present data is maintained in a database. The output must be contained in a single table. Which script should the data architect use?
A. Option A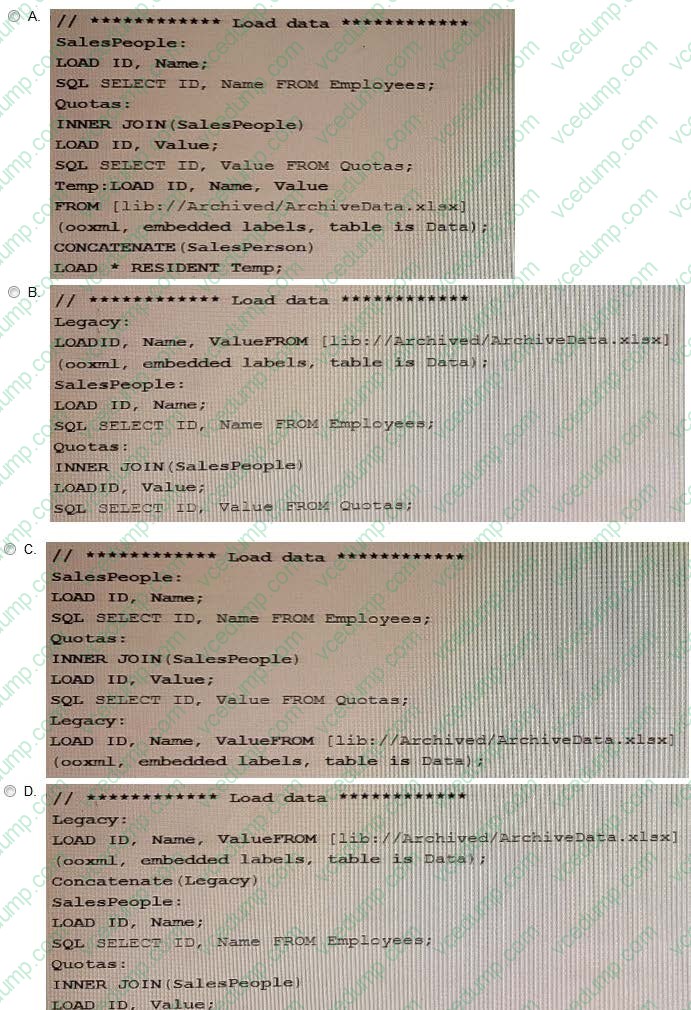
B. Option B
C. Option C
D. Option D -
Question 26:
A data architect needs to develop a script to export tables from a model based upon rules from an independent file. The structure of the text file with the export rules is as follows:
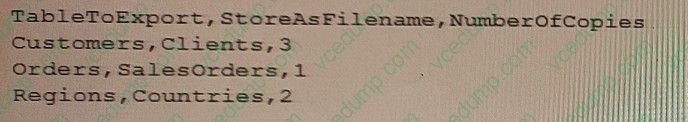
These rules govern which table in the model to export, what the target root filename should be, and the number of copies to export.
The TableToExport values are already verified to exist in the model.
In addition, the format will always be QVD, and the copies will be incrementally numbered.
For example, the Customer table would be exported as:
What is the minimum set of scripting strategies the data architect must use?
A. Two loops without any conditional statement
B. One loop and two IF statements
C. Two loops and one IF statement
D. One loop and one SELECT CASE statement -
Question 27:
Refer to the exhibit.
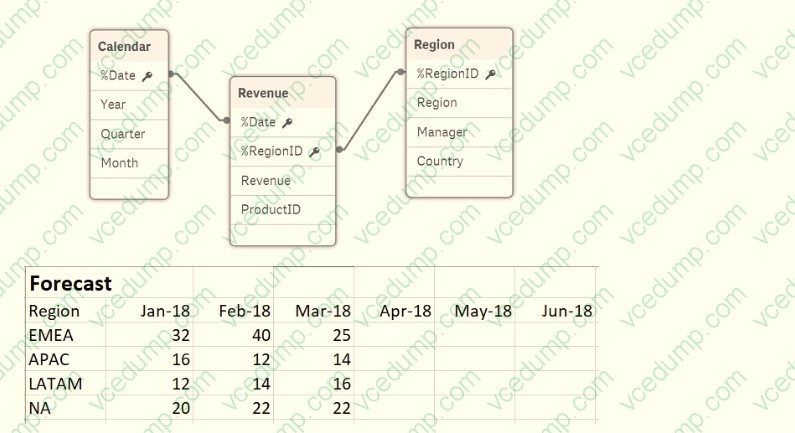
A business department is forecasting revenue within an Excel spreadsheet.
A data architect needs to include this forecast into the existing data model, and without losing any data.
Which two sets of steps will meet these requirements? (Select two.)
A. 1. Load the Excel spreadsheet using the data load editor 2. Use the Unpivot function 3. Use the Sum function to group the forecast by date 4. Connect to the existing data model
B. 1. Load the Excel spreadsheet using the data load editor 2. Use the Crosstable function to unpivot the table 3. Create a composite key out of the date and region 4. Connect the new table to the data model
C. 1 Load the Excel spreadsheet using the data load editor 2. Change the sort order by date 3. Create a composite key out of the forecast and region 4. Connect to the existing data model
D. 1 Load the Excel spreadsheet into the data manager 2. Use the Unpivot function 3. Create a composite key from the date and region 4. Connect the new table to the data model
E. 1. Load the Excel spreadsheet using the data manager 2. Rename the ForecastDate field to Date 3. Disable the Region 4. Connect to the existing data model -
Question 28:
Refer to the exhibit.
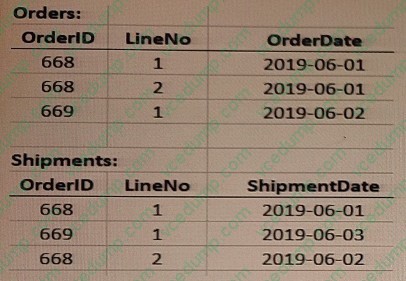
A data architect is loading the tables and a synth key is generated. How should the data architect resolve the synthetic key?
A. Remove the LineNo field from Shipments and use the AutoNumber function on the
B. Create a composite key using OrdertD and LineNo
C. Remove the LineNo field from both tables and use the AutoNumber function on the OrderlC field
D. Create a composite key using OrderlD and LineNo. and remove OrderlD and LineNo from Shipments -
Question 29:
A data architect plans to build an app that contains geographically diverse data that must be specific to user run-time selections. The source contains transactional data. The app must have minimal impact on already limited server resources.
Which approach should the data architect use?
A. Loop and Reduce
B. QVDs
C. In-memory
D. ODAG -
Question 30:
A data architect needs to load data from two different databases Additional data will be added from a folder that contains QVDs. text files, and Excel files. What is the minimum number of data connections required?
A. Two
B. Five
C. Four
D. Three
Related Exams:
-
QREP
Qlik Replicate Certification -
QSBA2021
Qlik Sense Business Analyst Certification - February 2021 Release -
QSBA2024
Qlik Sense Business Analyst Certification - 2024 -
QSDA2018
Qlik Sense Data Architect Certification - June 2018 Release -
QSDA2019
Qlik Sense Data Architect Certification - June 2019 Release -
QSDA2021
Qlik Sense Data Architect Certification - February 2021 Release -
QSDA2022
Qlik Sense Data Architect Certification - 2022 -
QSDA2024
Qlik Sense Data Architect Certification - 2024 -
QSSA2018
Qlik Sense System Administrator Certification - June 2018 Release -
QV_DEVELOPER_01
QlikView 11 Developer Certification
Tips on How to Prepare for the Exams
Nowadays, the certification exams become more and more important and required by more and more enterprises when applying for a job. But how to prepare for the exam effectively? How to prepare for the exam in a short time with less efforts? How to get a ideal result and how to find the most reliable resources? Here on Vcedump.com, you will find all the answers. Vcedump.com provide not only QlikView exam questions, answers and explanations but also complete assistance on your exam preparation and certification application. If you are confused on your QSDA2022 exam preparations and QlikView certification application, do not hesitate to visit our Vcedump.com to find your solutions here.