QSDA2019 Exam Details
-
Exam Code
:QSDA2019 -
Exam Name
:Qlik Sense Data Architect Certification - June 2019 Release -
Certification
:QlikView Certifications -
Vendor
:QlikView -
Total Questions
:52 Q&As -
Last Updated
:Jul 09, 2026
QlikView QSDA2019 Online Questions & Answers
-
Question 11:
A data architect needs to create an app to analyze 30-day re-admissions at a hospital.
A. Sequence patient records by hospital account ID and patient ID using the Peek function
B. Sequence patient records by patient ID using the Peek function
C. Calculate the days since previous discharge using admission date and discharge date
D. Order patient records by patient ID and admission date -
Question 12:
Refer to the exhibit.
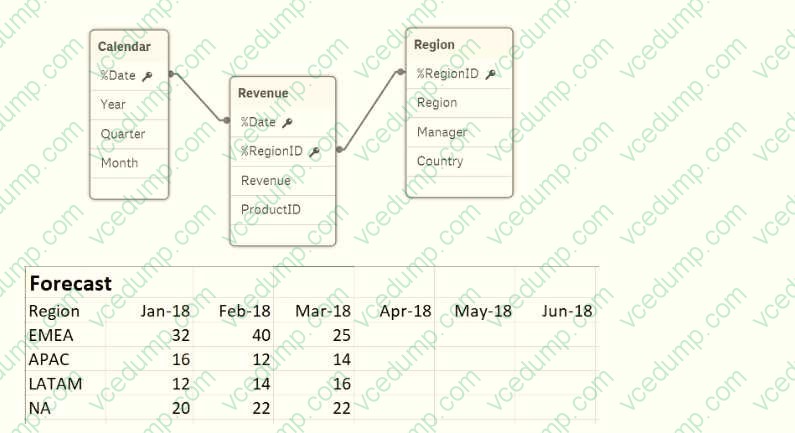
A business department is forecasting revenue within an Excel spreadsheet. A data architect needs to include this forecast into the existing data model, and without losing any data. Which two sets of steps will meet these requirements? (Select two.)
A. 1. Load the Excel spreadsheet using the data load editor 2. Use the Unpivot function 3. Use the Sum function to group the forecast by date 4. Connect to the existing data model
B. 1. Load the Excel spreadsheet using the data load editor 2. Use the Crosstable function to unpivot the table 3 Create a composite key out of the date and region 4 Connect the new table to the data model
C. 1. Load the Excel spreadsheet using the data load editor 2. Change the sort order by date 3. Create a composite key out of the forecast and region 4. Connect to the existing data model
D. 1. Load the Excel spreadsheet into the data manager 2. Use the Unpivot function 3. Create a composite key from the date and region 4. Connect the new table to the data model
E. 1. Load the Excel spreadsheet using the data manager 2. Rename the ForecastDate field to Date 3. Disable the Region 4. Connect to the existing data model -
Question 13:
Refer to the exhibit.
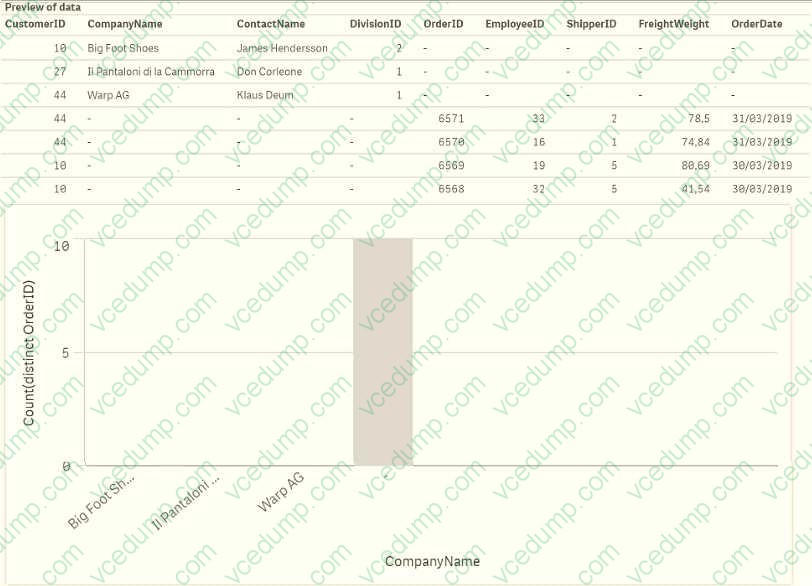
A data architect needs to analyze the number of orders by customer. The data is stored in two Excel files: Orders and Customers The data architect creates a bar chart, but the data is obviously incorrect. What should the data architect do to resolve this issue?
A. Open the data manager, split the Customers table, and Concatenate Orders and Customers on the CustomerlD field
B. Open the data manager split the Customers table, and associate on CustomerlD
C. Open the data load editor, use CONCATENATE to concatenate Orders and Customers
D. Open the data load editor, rename the CustomerlD field, and concatenate Orders and Customers -
Question 14:
A data architect executes the following script:
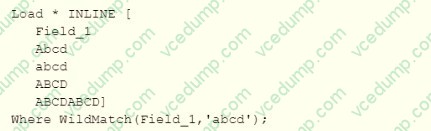
What will Field_1 contain after this script is executed?
A. Abcd, abcd
B. abed
C. Abed. abed. ABCD, ABCDABCD
D. Abcd, abcd. ABCD -
Question 15:
Refer to the exhibit.
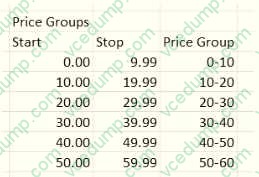
A clothing retailer wants to review their product pricing strategy. A data architect must classify each product into a price group. The price groups must be the same width by default and allow users to dynamically change the width of the bucket during analysis.
Which feature should the data architect use to meet these requirements?
A. IntervalMatch and use variables
B. Nested IFs in a calculated dimension
C. Class function in a calculated dimension
D. Class function in the script and use variables -
Question 16:
Refer to the exhibit.
A. The UserAccess table contains seven fields Year Month, Hourr AccesslD. AccessDate. UserlD, and Duration (minutes) The table is only linked to Users on the UserlD field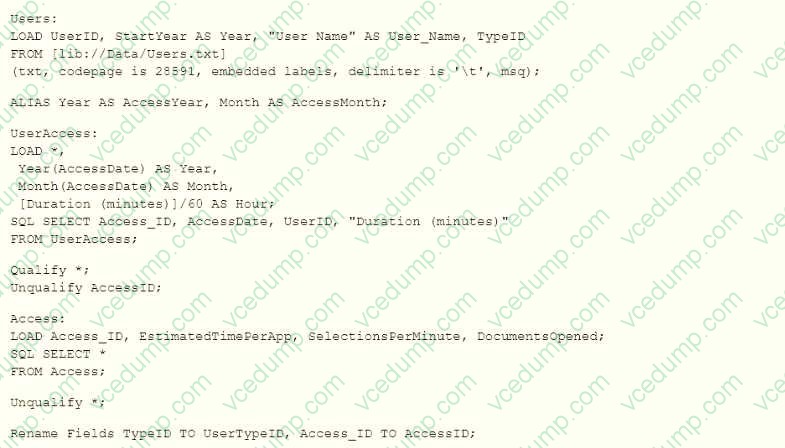
B. The UserAccess Table contains seven fields: Year, Month. Hour. AccessID, AccessDate. UserlD, and Duration (minutes) The table is linked to the Access table with the AccessID field and linked to Users on the UserlD field
C. The UserAccess table contains seven fields AccessYear, AccessMonth, Hour AccesslD, AccessDate, UserlD, and Duration (minutes) The table is only linked to Users on the UserlD field
D. The UserAccess table contains seven fields AccessYear. AccessMonth. Hour. AccesslD, AccessDate. UserlD. and Duration (minutes) The table is linked to the Access table on the AccesslD field and linked to Users on the UserlD field -
Question 17:
A customer has a dataset that contains latitude and longitude data for service points around the country. The data is retrieved using the following statement: It must be clear to the end user that this is geographic data.
A. Define Location as a master item, and set the tag to Sgeodata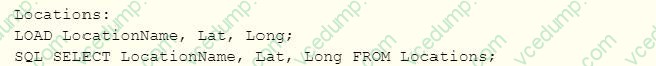
B. Add GeoProject{' Point' , LatandLong) AS Point to the preceding load
C. Add GeoKakePoint (Lat, Long} as Point to Location's preceding load
D. Add the following to the end of the script: TAG FIELD LocationName With 'Sgeodata1, 'Srelated'; TAG FIELD Point With 'Sgeodata', 'Srelated1;
E. Add the following to the end of the script: TAG FIELD LocationName With 'Sgeoname', @relates_Pt'; TAG FIELD Point With 'Sgeopoint*f 'Srelates Location', '$hidden'; -
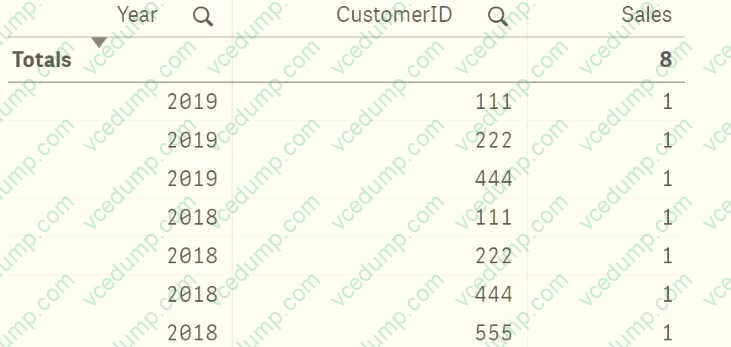
Question 18:
Refer to the exhibit.
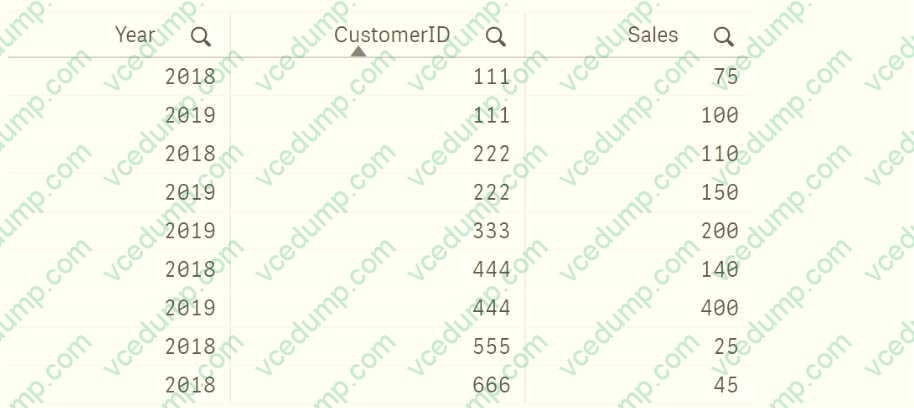
A data architect loads sales data and creates a table which shows only customers who made purchases in 2018 and 2019. The data architect applies the following set analysis expression on the sales measure. Count<{
A)
B)
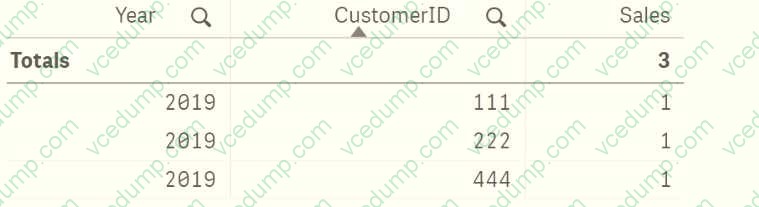
C)
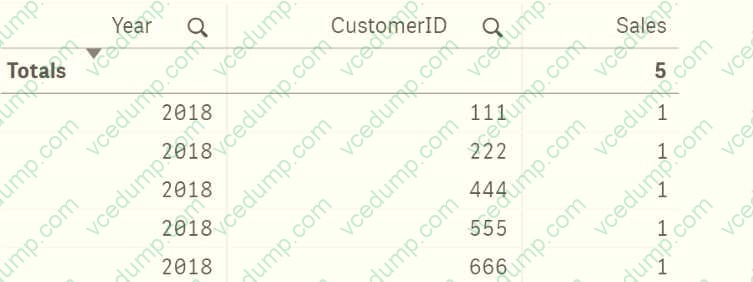
D)
A. Option A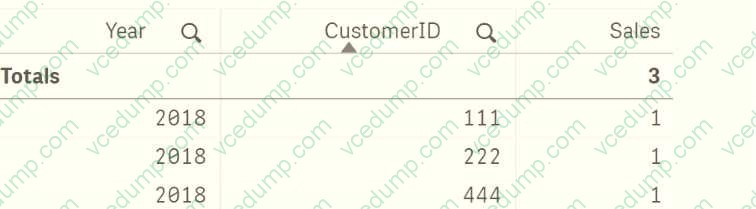
B. Option B
C. Option C
D. Option D -
Question 19:
A company needs to analyze sales data based on the exchange rate of the different countries every day About 30 reports must be produced with an average of 20r000 rows each. This process is estimated to take about three hours. Reports will be in Excel and distributed to business users according to defined security rules.
Which two products should the data architect use to build this solution? (Select two.)
A. OQIikGeoAnalytics
B. ODAG
C. QIikDataMarket
D. Qlik Storytelling
E. QIik NPrinting -
Question 20:
Refer to the exhibit.
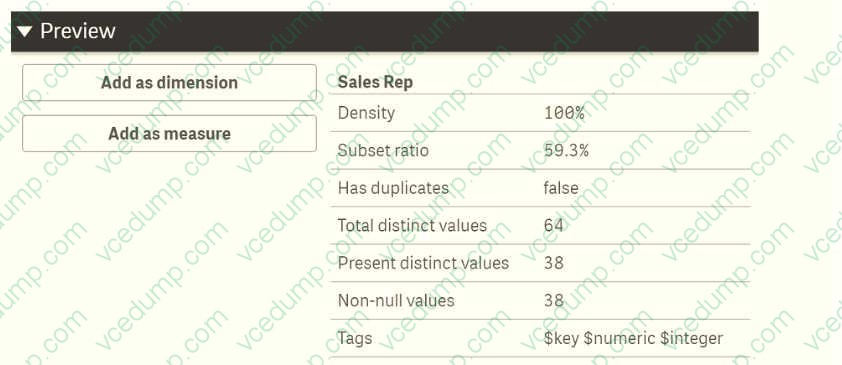
Refer to the exhibits.
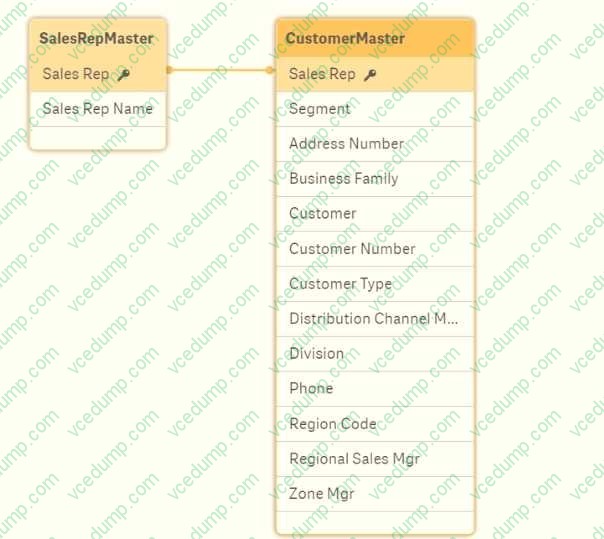
While using an app, the users report that some Sales Reps do NOT have personal details, like Division or Address Number A data architect has been called in to investigate. The data architect uses the data model viewer to determine the
relationship between the SalesRepMaster and CustomerMaster tables.
What is the cause of the issue?
A. 26 values for Sales Rep are null in CustomerMaster
B. 40.7% of the Sales Rep have CustomerMaster information
C. 59.3% of the Sales Rep have CustomerMaster information
D. Density is 100% while Total Distinct and Present Distinct are NOT the same
Related Exams:
-
QREP
Qlik Replicate Certification -
QSBA2021
Qlik Sense Business Analyst Certification - February 2021 Release -
QSBA2024
Qlik Sense Business Analyst Certification - 2024 -
QSDA2018
Qlik Sense Data Architect Certification - June 2018 Release -
QSDA2019
Qlik Sense Data Architect Certification - June 2019 Release -
QSDA2021
Qlik Sense Data Architect Certification - February 2021 Release -
QSDA2022
Qlik Sense Data Architect Certification - 2022 -
QSDA2024
Qlik Sense Data Architect Certification - 2024 -
QSSA2018
Qlik Sense System Administrator Certification - June 2018 Release -
QV_DEVELOPER_01
QlikView 11 Developer Certification
Tips on How to Prepare for the Exams
Nowadays, the certification exams become more and more important and required by more and more enterprises when applying for a job. But how to prepare for the exam effectively? How to prepare for the exam in a short time with less efforts? How to get a ideal result and how to find the most reliable resources? Here on Vcedump.com, you will find all the answers. Vcedump.com provide not only QlikView exam questions, answers and explanations but also complete assistance on your exam preparation and certification application. If you are confused on your QSDA2019 exam preparations and QlikView certification application, do not hesitate to visit our Vcedump.com to find your solutions here.