Exam Details
Exam Code
:QSBA2018Exam Name
:Qlik Sense Business Analyst Certification - June 2018 ReleaseCertification
:QlikView CertificationsVendor
:QlikViewTotal Questions
:60 Q&AsLast Updated
:Dec 14, 2024
QlikView QlikView Certifications QSBA2018 Questions & Answers
-
Question 31:
A company has customers in 16 countries. The majority of the customers are in Germany.
A business analyst creates a filter pane for Country, and wants "Germany" listed first. The rest of the
countries should be listed in alphabetical order.
Which method should the business analyst use to meet this requirement?
A. Edit the sheet, select Chart, Properties panel, Custom sorting, then select Germany
B. Edit the sheet, select Chart, Properties panel, Custom sorting, then click Descending Frequency
C. In the data manager, edit the table, select Country, then select Order from the data profiling card
D. In the data manager, edit the table, select Country, then select Order from the column header
-
Question 32:
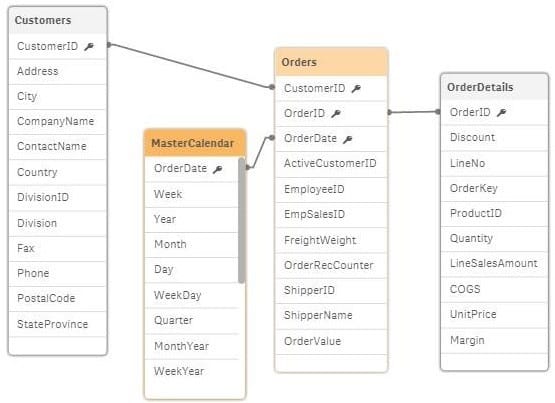
Refer to the exhibit.
A business analyst is testing an existing app that returns unexpected results.
Using the selection tool, the business analyst observes the following behavior. Select a CompanyName and the associated OrderID records are white Select a Year and all OrderID records are gray Select an OrderID and the Quarter values are all gray, but the CompanyNames are white Select a ProductID and the associated ShipperName and OrderDates are white, but the Year is gray
What is causing these results?
A. OrderID should be the key field in the MasterCalendar
B. The logical model is NOT a star schema
C. The OrderDate fields are different data types
D. MasterCalendar should be associated to the OrderDetails table
-
Question 33:
A business analyst is NOT familiar with the data and is using insight advisor to create a number of visualizations.
Which steps should the business analyst take to add the visualizations to a sheet?
A. Click Generate insights to find visualizations, then click Add to sheet
B. Use the selection tool to find visualizations, then click Add to sheet
C. Use smart search to find visualizations, then click Add to sheet
D. Drag and drop fields on the workspace, then click Add to sheet
-
Question 34:
Refer to the exhibits.
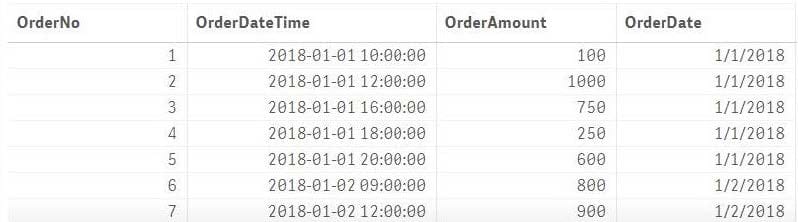
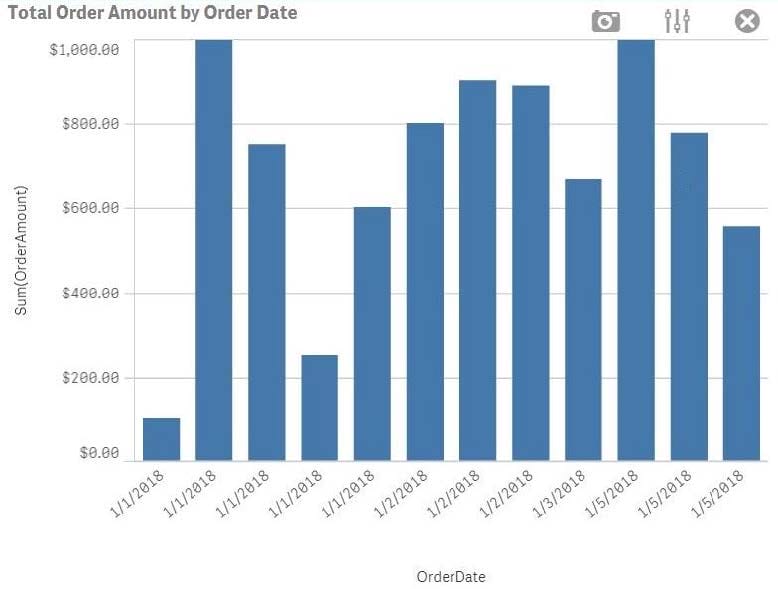
A business analyst must create a bar chart to show the total value of orders processed per day. The dataset loaded by the data architect only contains the OrderNo, OrderDateTime, and OrderAmount. The business analyst creates a calculated field, OrderDate, using the expression, Date(OrderDateTime).
The bar chart does NOT present the information correctly. How should the business analyst fix the error?
A. Change the OrderDate number formatting to `Date' in the properties panel
B. Create a new calculated field for OrderDate with: Date(Floor(OrderDateTime))
C. Change the OrderDate field type to Date' in the format `YYYY-MM-DD' in the data manager.
D. Create a new calculated field for OrderDate with: Date(LTrim(OrderDateTime,10))
-
Question 35:
Refer to the exhibit.
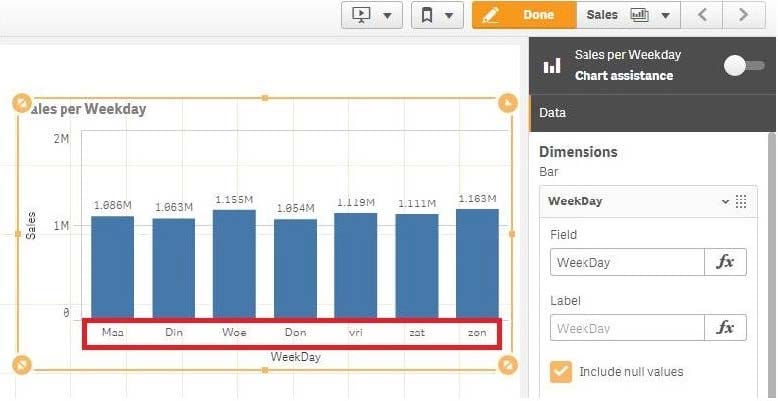
A business analyst creates a bar chart and notices the weekdays are NOT in a US default format. The
analyst does NOT have permissions to enter the data load editor and edit the data. The analyst only has a
few minutes before the meeting to show the insights to a manager.
The business analyst wants to quickly customize the chart to show the weekdays in US format.
Which action should the business analyst take to fix the chart?
A. Change the dimension label using the DATE() function to specify the right data format.
B. Change the dimension to a calculated dimension to specify the right data format.
C. Change the dimension label to a calculated dimension using an IF() function.
D. Change the dimension to a calculated dimension using the REPLACE() function.
-
Question 36:
Refer to the exhibit.
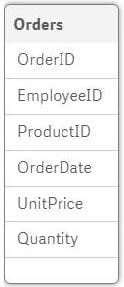
A business analyst must analyze sales using an existing sales order app. The Orders table in the app was added from a QVD file using the data manager The Orders table in the app and the QVD do NOT contain a SalesAmount field SalesAmount can be calculated by multiplying the Quantity and UnitPrice
How should the business analyst add a SalesAmount field into the Orders table?
A. In the data manager, create a new calculated field, SalesAmount, and set the expression value to Sum (UnitPrice * Quantity)
B. In the data mode viewer, add a calculated field named SalesAmount with the expression UnitPrice * Quantity
C. In the data manager, add a calculated field named SalesAmount with the expression UnitPrice * Quantity
D. In the Orders QVD file, add an additional field named SalesAmount with the expression UnitPrice * Quantity
-
Question 37:
A business analyst uses the data manager to load customer data from a QVD file. The data manager automatically profiles the data, and recognizes City and Country values as Geo data.
The app must meet the following requirements: Country field should be in Geo data format City should NOT be allowed as a mapping option for the users There must be an association between the Country and City fields
Which actions should the business analyst take to meet these requirements?
A. 1. In the Associations view, select the City field
2. Delete $geoname-tag from field properties
B. 1. In the Associations view, select the City field
2. Change the format from `Geo data' to `No data profiling'
C. 1. In the Associations view, select the City field
2. Delete the City field
D. 1. In the Associations view, select the City field
2. Change the format from `Geo data' to `General'
-
Question 38:
A business analyst is creating a dashboard to analyze supply chains. The app must contain several elements: A bar chart that shows a number of products and product groups handled by shipper A map that shows the number of shipments sent from factory locations A bar chart that shows average delivery costs by shipper
Which dimensions should the business analyst use for this app?
A. Product, Shipper, FactoryLocation
B. Shipper, FactoryLocation
C. Shipper, Product
D. Product, ProductGroup, Shipper
-
Question 39:
A business analyst must display current year sales versus previous year sales by region, sub-region, and city.
The result will be a pivot table, with rows for the region, sub-region, and city, and columns for Current Year Sales and Previous Year Sales.
Which calculated expressions should the business analyst create to meet these requirements?
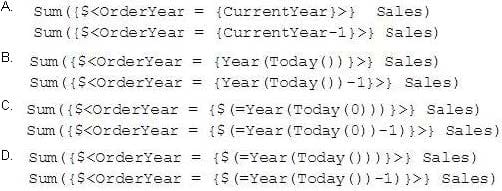
A. B. C. D.
-
Question 40:
A business analyst needs to create an app showing sales data. The app requirements are as follows:
Compare sales for the current year (CY Sales) versus last year (LY Sales)
CY Sales must always be displayed in blue
LY Sales must always be displayed in yellow
Which steps should the business analyst take to meet these requirements?
A. 1. Create a KPI with two measures, CY Sales and LY Sales
2. Write an IF expression to set the appropriate colors for each measure
B. 1. Create CY Sales and LY Sales measures as master items
2. Write an IF expression to set the appropriate colors for the master items
C. 1. Create CY Sales and LY Sales measures as master items and set the required color for each measure
2. Create one KPI from the two master item measures
D. 1. Create CY Sales and LY Sales measures as master items and set the required color for each measure using Value colors
2. Create two gauges, one for each measure and set the color for each appropriately
Related Exams:
QREP
Qlik Replicate CertificationQSBA2021
Qlik Sense Business Analyst Certification - February 2021 ReleaseQSBA2024
Qlik Sense Business Analyst Certification - 2024QSDA2018
Qlik Sense Data Architect Certification - June 2018 ReleaseQSDA2019
Qlik Sense Data Architect Certification - June 2019 ReleaseQSDA2021
Qlik Sense Data Architect Certification - February 2021 ReleaseQSDA2022
Qlik Sense Data Architect Certification - 2022QSDA2024
Qlik Sense Data Architect Certification - 2024QSSA2018
Qlik Sense System Administrator Certification - June 2018 ReleaseQV_DEVELOPER_01
QlikView 11 Developer Certification
Tips on How to Prepare for the Exams
Nowadays, the certification exams become more and more important and required by more and more enterprises when applying for a job. But how to prepare for the exam effectively? How to prepare for the exam in a short time with less efforts? How to get a ideal result and how to find the most reliable resources? Here on Vcedump.com, you will find all the answers. Vcedump.com provide not only QlikView exam questions, answers and explanations but also complete assistance on your exam preparation and certification application. If you are confused on your QSBA2018 exam preparations and QlikView certification application, do not hesitate to visit our Vcedump.com to find your solutions here.